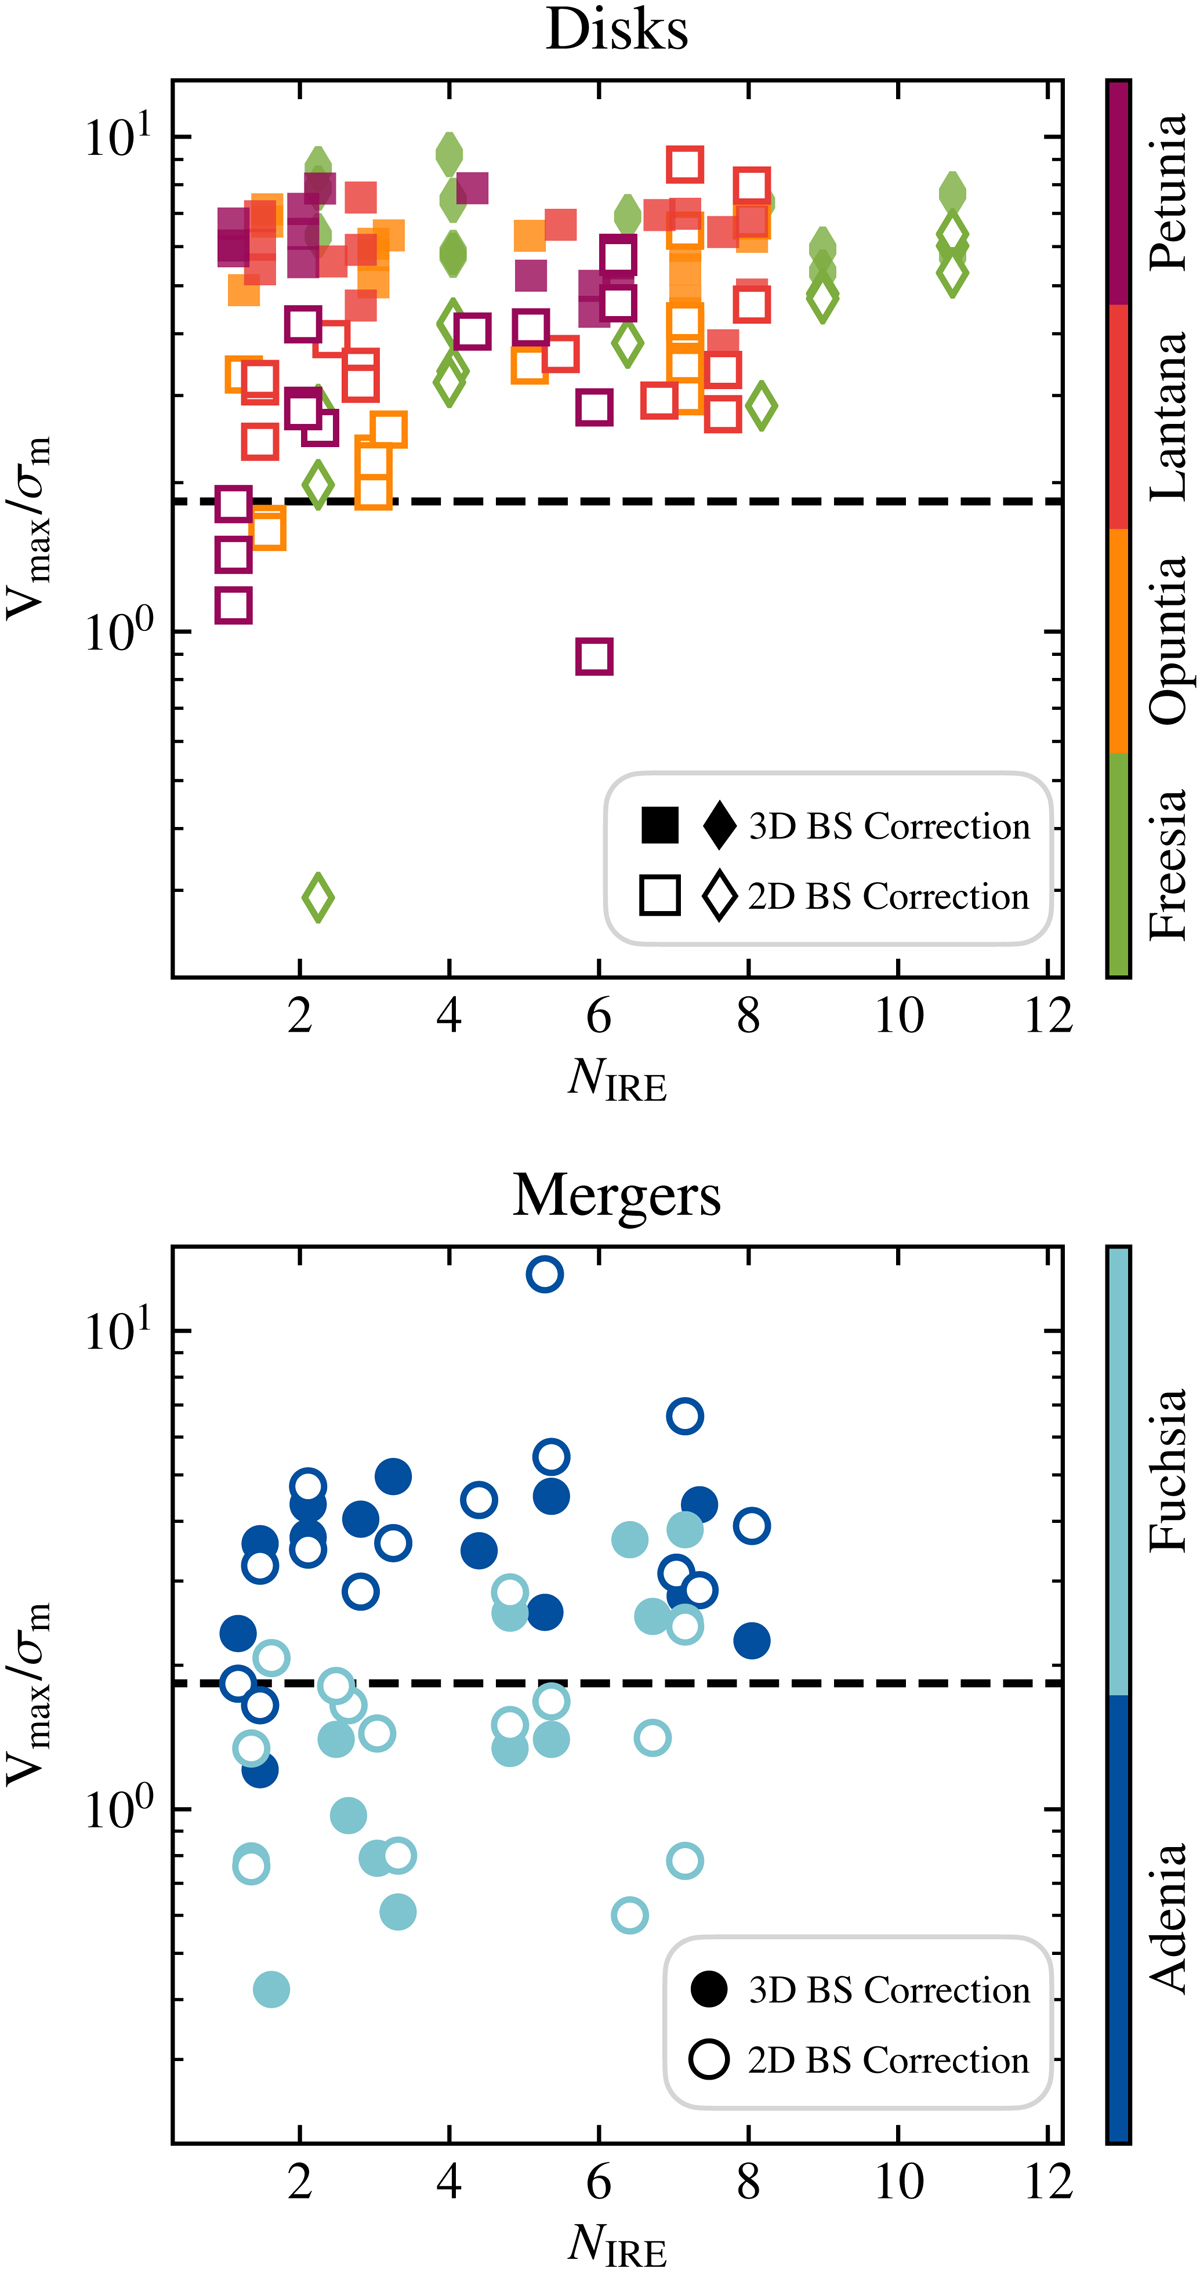
Fig. 9.
Download original image
V/σ ratio as a function of resolution (number of independent resolution elements along the semi-major axis) for the disks and the disturbed disk (upper panel) and the mergers (bottom panel). Markers with the same color show the mock data for the same SERRA galaxy as indicated by the color-bar. The black dashed line shows the threshold at 1.8. The filled markers show the V/σ ratios obtained with 3DBAROLO that is a 3D forward-modeling approach is applied to correct for the beam-smearing effect. The empty markers show the V/σ obtained when a velocity-gradient method is employed to correct for the beam-smearing effect.
Current usage metrics show cumulative count of Article Views (full-text article views including HTML views, PDF and ePub downloads, according to the available data) and Abstracts Views on Vision4Press platform.
Data correspond to usage on the plateform after 2015. The current usage metrics is available 48-96 hours after online publication and is updated daily on week days.
Initial download of the metrics may take a while.