Fig. 6.
Download original image
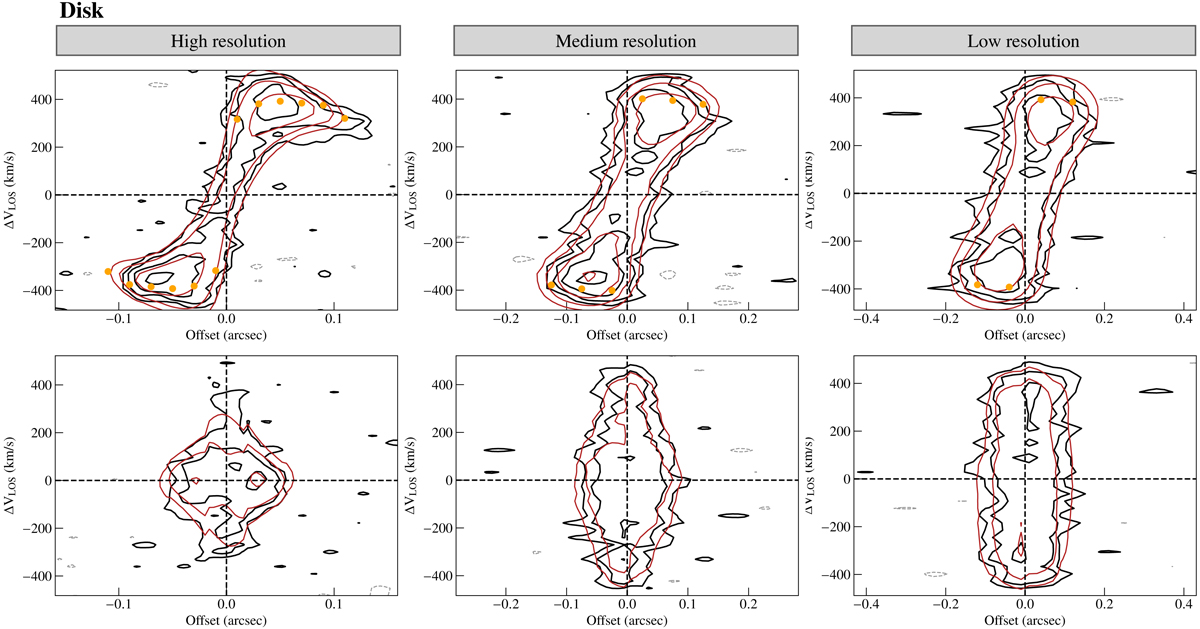
Position-velocity diagrams along the kinematic major (upper panels) and minor axis (bottom panels) for the disk Petunia at 60 deg. The horizontal axis shows the offset from the galaxy center, and the vertical axis represents the line-of-sight velocity centred at the systemic velocity of the galaxy. From left to right, the high S/N ALMA mock data at high-, medium- and low-angular resolutions are shown. The black and red contours show the data and the 3DBAROLO model, respectively. The level contours are at −2.5, 2.5, 5 and 10 times the rms noise. The orange circles show the best-fit rotation velocities (not corrected for inclination) derived using 3DBAROLO.
Current usage metrics show cumulative count of Article Views (full-text article views including HTML views, PDF and ePub downloads, according to the available data) and Abstracts Views on Vision4Press platform.
Data correspond to usage on the plateform after 2015. The current usage metrics is available 48-96 hours after online publication and is updated daily on week days.
Initial download of the metrics may take a while.