Fig. 5.
Download original image
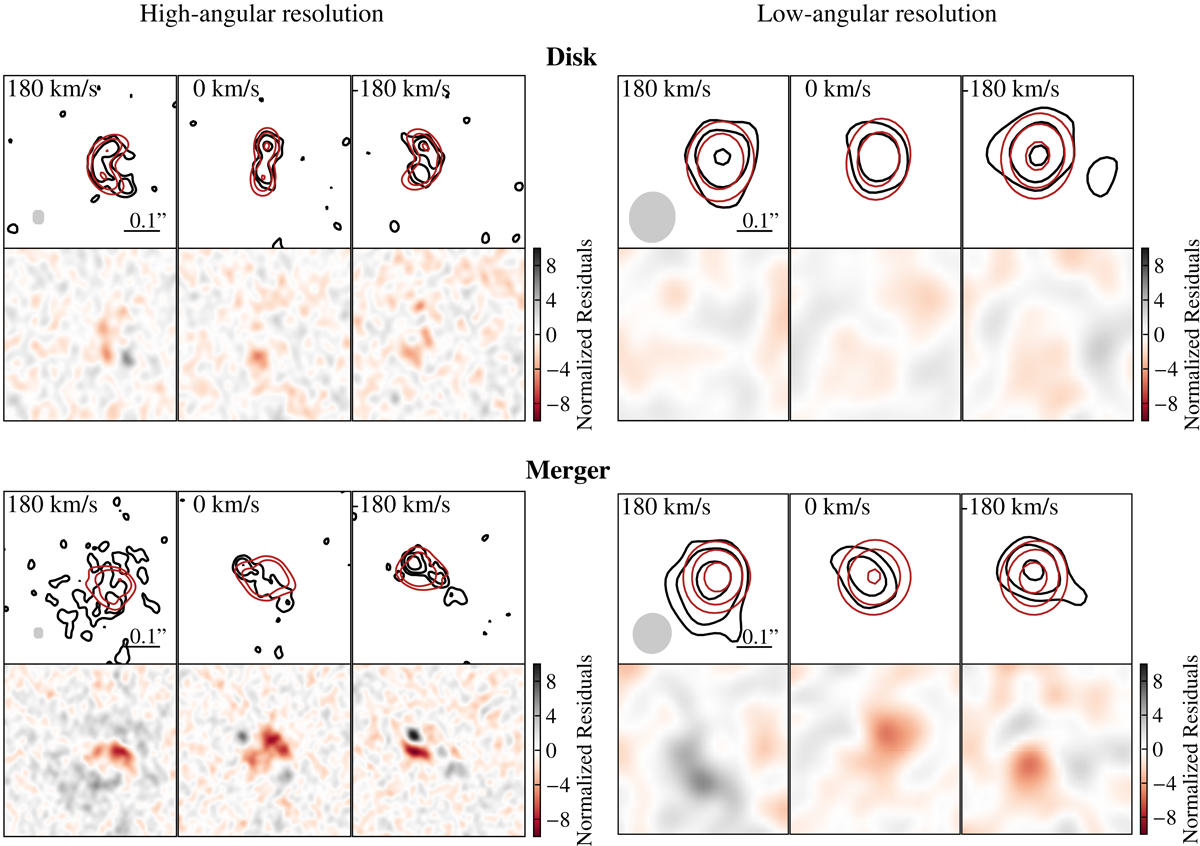
Three representative spectral channels at velocities 180, 0, −180 km s−1, for the disk Petunia (upper panels) and the merger Adenia (bottom panels) at 60 deg. The left and right subfigures show the high S/N ALMA mock data at high and low-angular resolution. For each subfigure: the upper row shows the data (black contours) and the 3DBAROLO model (red contours). The contour levels are at 2.5, 5, 10 times the rms noise per channel. The gray ellipses in the first panels denote the synthetized beam of the observations. The bottom row shows the residuals normalized to the rms noise.
Current usage metrics show cumulative count of Article Views (full-text article views including HTML views, PDF and ePub downloads, according to the available data) and Abstracts Views on Vision4Press platform.
Data correspond to usage on the plateform after 2015. The current usage metrics is available 48-96 hours after online publication and is updated daily on week days.
Initial download of the metrics may take a while.