Fig. 3.
Download original image
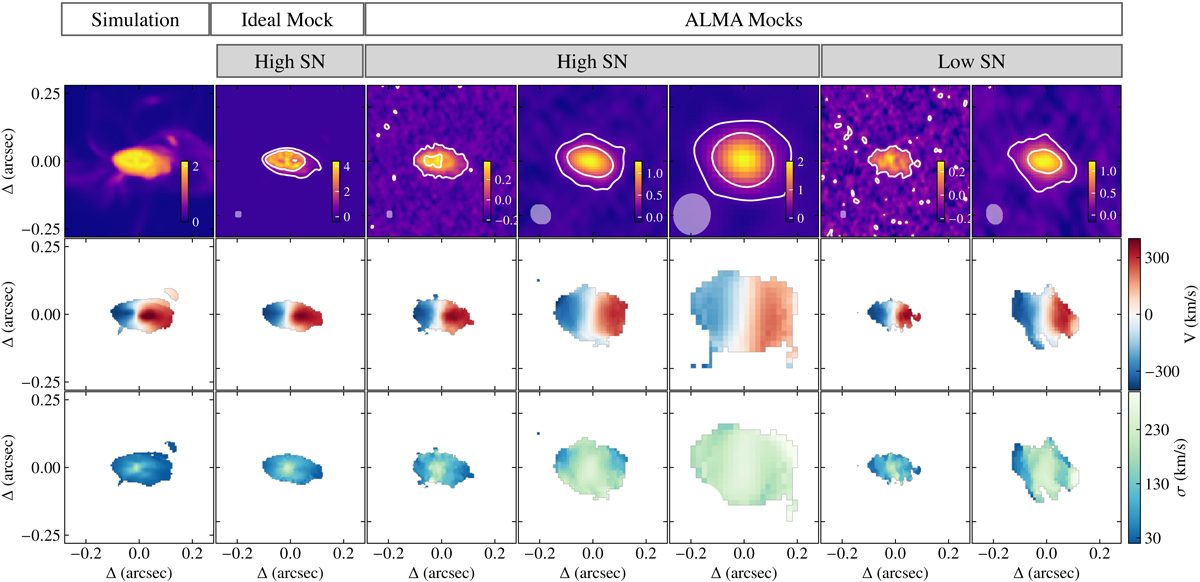
Moment-0 (upper panels), 1 (medium panels), and 2 (bottom panels) for the disk Petunia at 60 deg obtained from the simulated cube (Col. 1) and the mock cubes described at points a) – d) in Sect. 4 (Cols. 2–7) at different angular resolutions (the beam is shown in the bottom left corner as the gray ellipse). In the mock moment-0 maps, the white contours are at 2 and 10 times the rms noise and the color bars are in units of 10 mJy pixel−1 km s−1 in the first column and 100 mJy beam−1 km s−1 for the mock observations.
Current usage metrics show cumulative count of Article Views (full-text article views including HTML views, PDF and ePub downloads, according to the available data) and Abstracts Views on Vision4Press platform.
Data correspond to usage on the plateform after 2015. The current usage metrics is available 48-96 hours after online publication and is updated daily on week days.
Initial download of the metrics may take a while.