Fig. 14.
Download original image
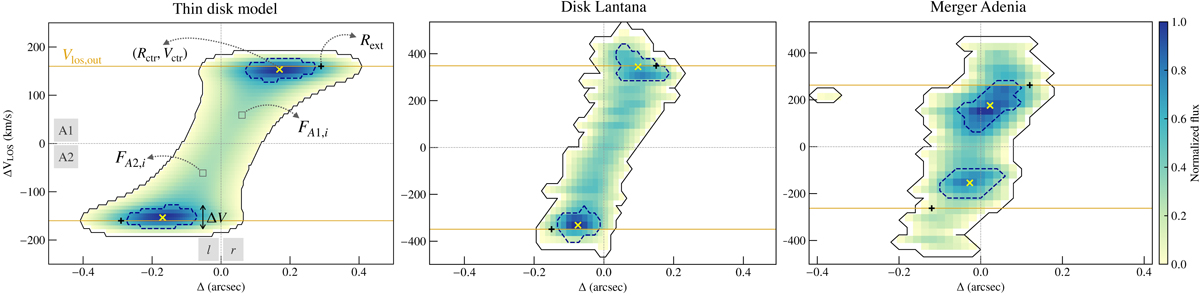
Schematic representation of the morphological and symmetrical features in the major axis PV diagrams considered for the computation of the P parameters defined in Sect. 7.1. Left panel: PV diagram for a representative thin rotating disk model along the major axis. The dotted gray horizontal line shows the position of the systemic velocity that divides the major-axis PV diagram into regions A1 and A2, while the dotted gray vertical lines indicate the center dividing A1 and A2 into two regions, l and r. The ith representative pixels used for the computation of Pmajor are shown in the regions A1 and A2, respectively. The blue dotted contours enclose the 20% brightest pixels, and the yellow crosses are their flux-weighted centroids. The black plus indicates the outermost radius used for the extraction of the kinematic parameters, and the solid orange lines are Vlos, out, the average values of the galaxy line-of-sight velocities. The double arrow indicates ΔV, the extension along the velocity axis for one of the peak distributions. The major-axis PV diagrams from the high S/N, low-resolution mock data of the disk Lantana and merger Adenia are shown in the central and right panels.
Current usage metrics show cumulative count of Article Views (full-text article views including HTML views, PDF and ePub downloads, according to the available data) and Abstracts Views on Vision4Press platform.
Data correspond to usage on the plateform after 2015. The current usage metrics is available 48-96 hours after online publication and is updated daily on week days.
Initial download of the metrics may take a while.