Fig. 12.
Download original image
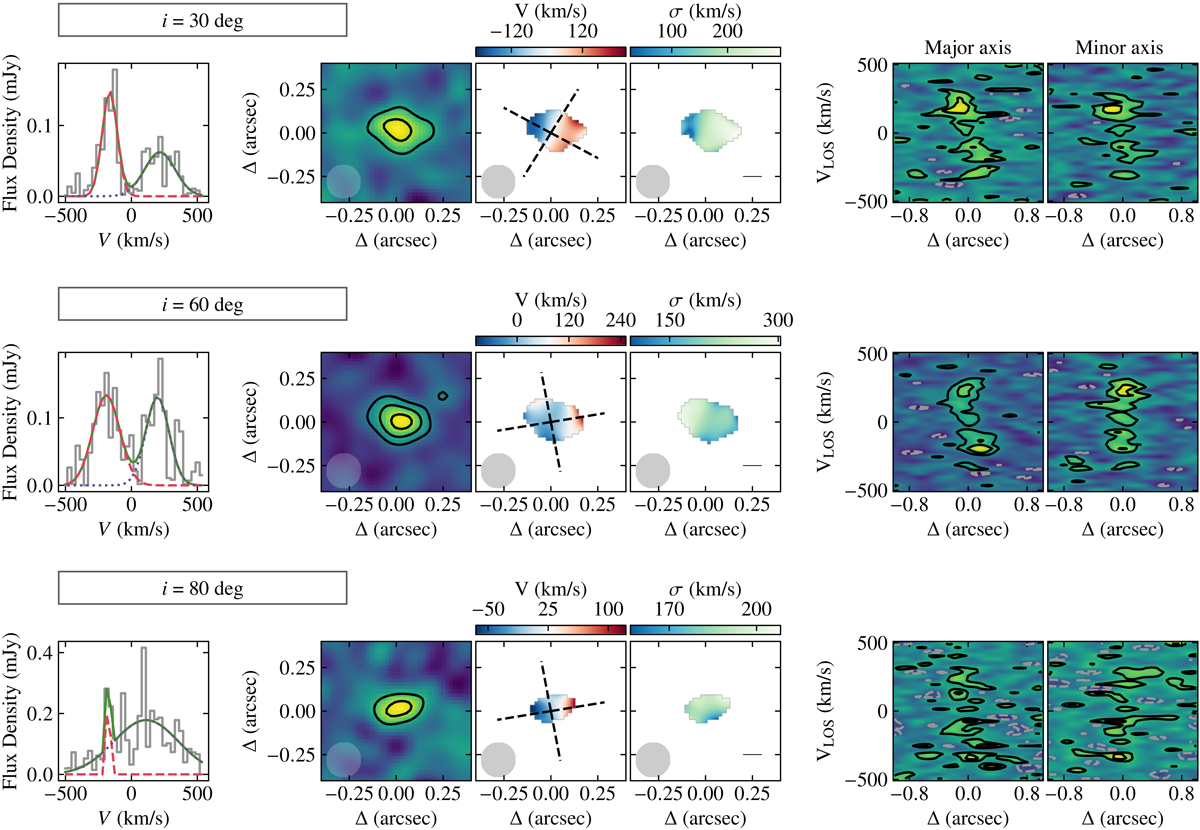
Kinematic maps and profile for the barely resolved ALMA mock data for the disk Opuntia at 30 (upper panels), 60 (medium panels) and 80 deg (bottom panels). Column 1: [C II] integrated spectrum (gray histogram) and best-fit model (solid green line), resulting from the sum of two components (red dashed and purple dotted lines). Column 2: moment-0 map with black contours showing the 3, 6 and 9 rms levels. Columns 3 and 4: moment-1 and moment-2 maps obtained following the methodology in Romano et al. (2021) (see Sect. 6.3 for details). The dashed lines in the moment-1 map show the directions of the major and minor axis along which the PV-diagrams are extracted. Columns 5 and 6: PV diagrams along the major (left) and minor (right) axis with contours at −2 rms (dashed gray lines) and 2, 4, 8 rms (solid black lines).
Current usage metrics show cumulative count of Article Views (full-text article views including HTML views, PDF and ePub downloads, according to the available data) and Abstracts Views on Vision4Press platform.
Data correspond to usage on the plateform after 2015. The current usage metrics is available 48-96 hours after online publication and is updated daily on week days.
Initial download of the metrics may take a while.