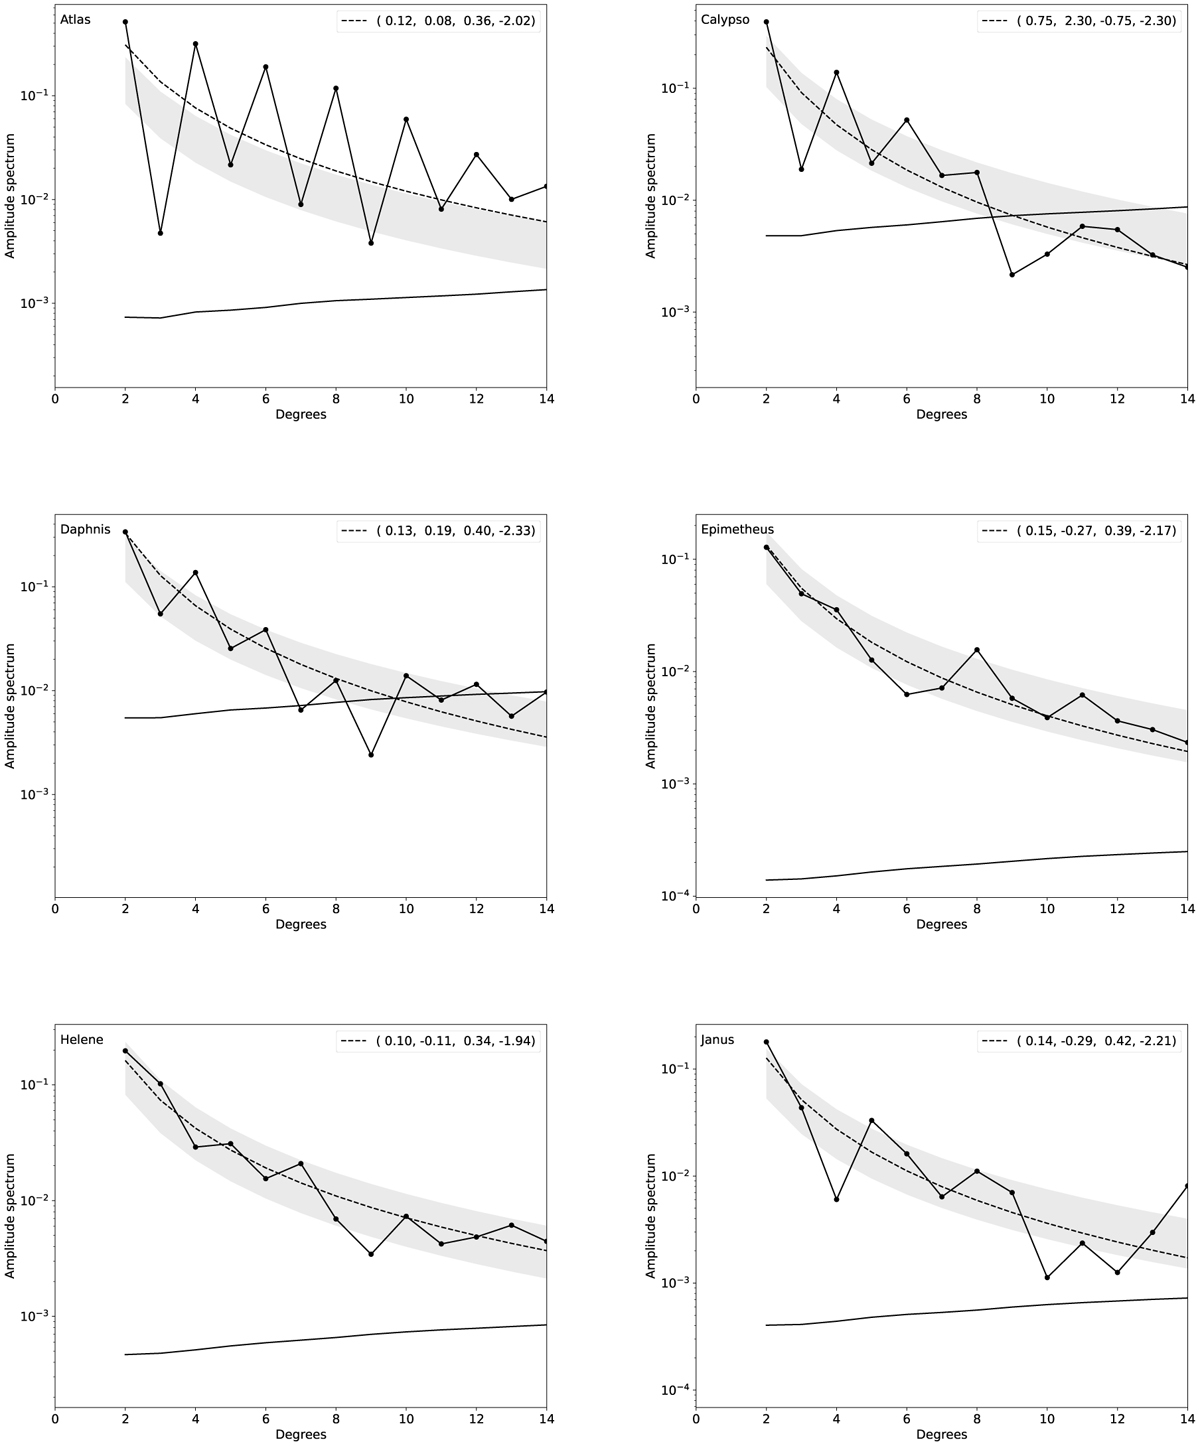
Fig. 6
Download original image
RMS spectrum topography for small satellites of Saturn. The black curve with points represents the spectrum, the solid-black curve is the uncertainty deduced from the least-square fit of the spherical harmonics to the shape models. The dashed-black curve corresponds to the fit of the Vening Meinez-Ermakov laws with the values of the parameters (A, αR, αρ, αn) for all satellites. The gray filled area give the range of values provided in Ermakov et al. (2018).
Current usage metrics show cumulative count of Article Views (full-text article views including HTML views, PDF and ePub downloads, according to the available data) and Abstracts Views on Vision4Press platform.
Data correspond to usage on the plateform after 2015. The current usage metrics is available 48-96 hours after online publication and is updated daily on week days.
Initial download of the metrics may take a while.