Fig. 5
Download original image
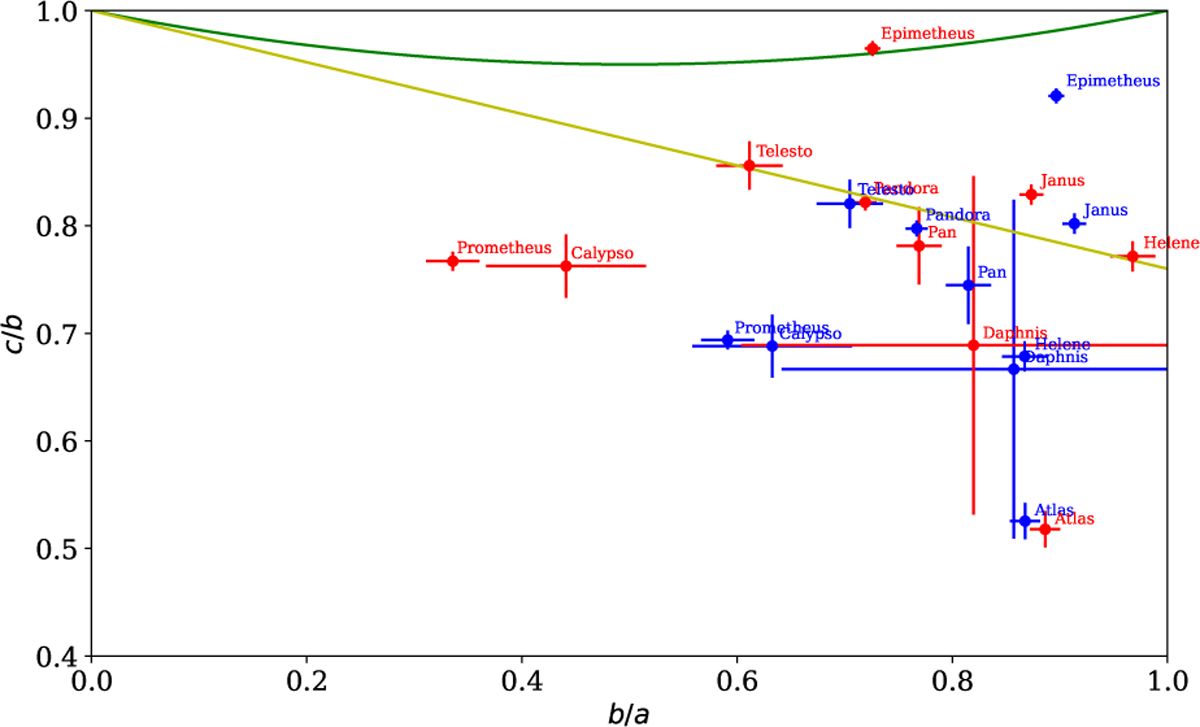
Ratios bT/aT and cT/bT with their uncertainties for the small satellites of Saturn for which DTMs are available (Thomas & Helfenstein 2020). The values in blue represents the best-fit ellipsoids of Thomas & Helfenstein (2020) whereas the red values represent the ellipsoid shape deduced from degrees 2 of our spherical harmonics decomposition. The green curve represents the Roche sequence and yellow line is the Omega sequence defined in Dobrovolskis (2019).
Current usage metrics show cumulative count of Article Views (full-text article views including HTML views, PDF and ePub downloads, according to the available data) and Abstracts Views on Vision4Press platform.
Data correspond to usage on the plateform after 2015. The current usage metrics is available 48-96 hours after online publication and is updated daily on week days.
Initial download of the metrics may take a while.