Fig. 1
Download original image
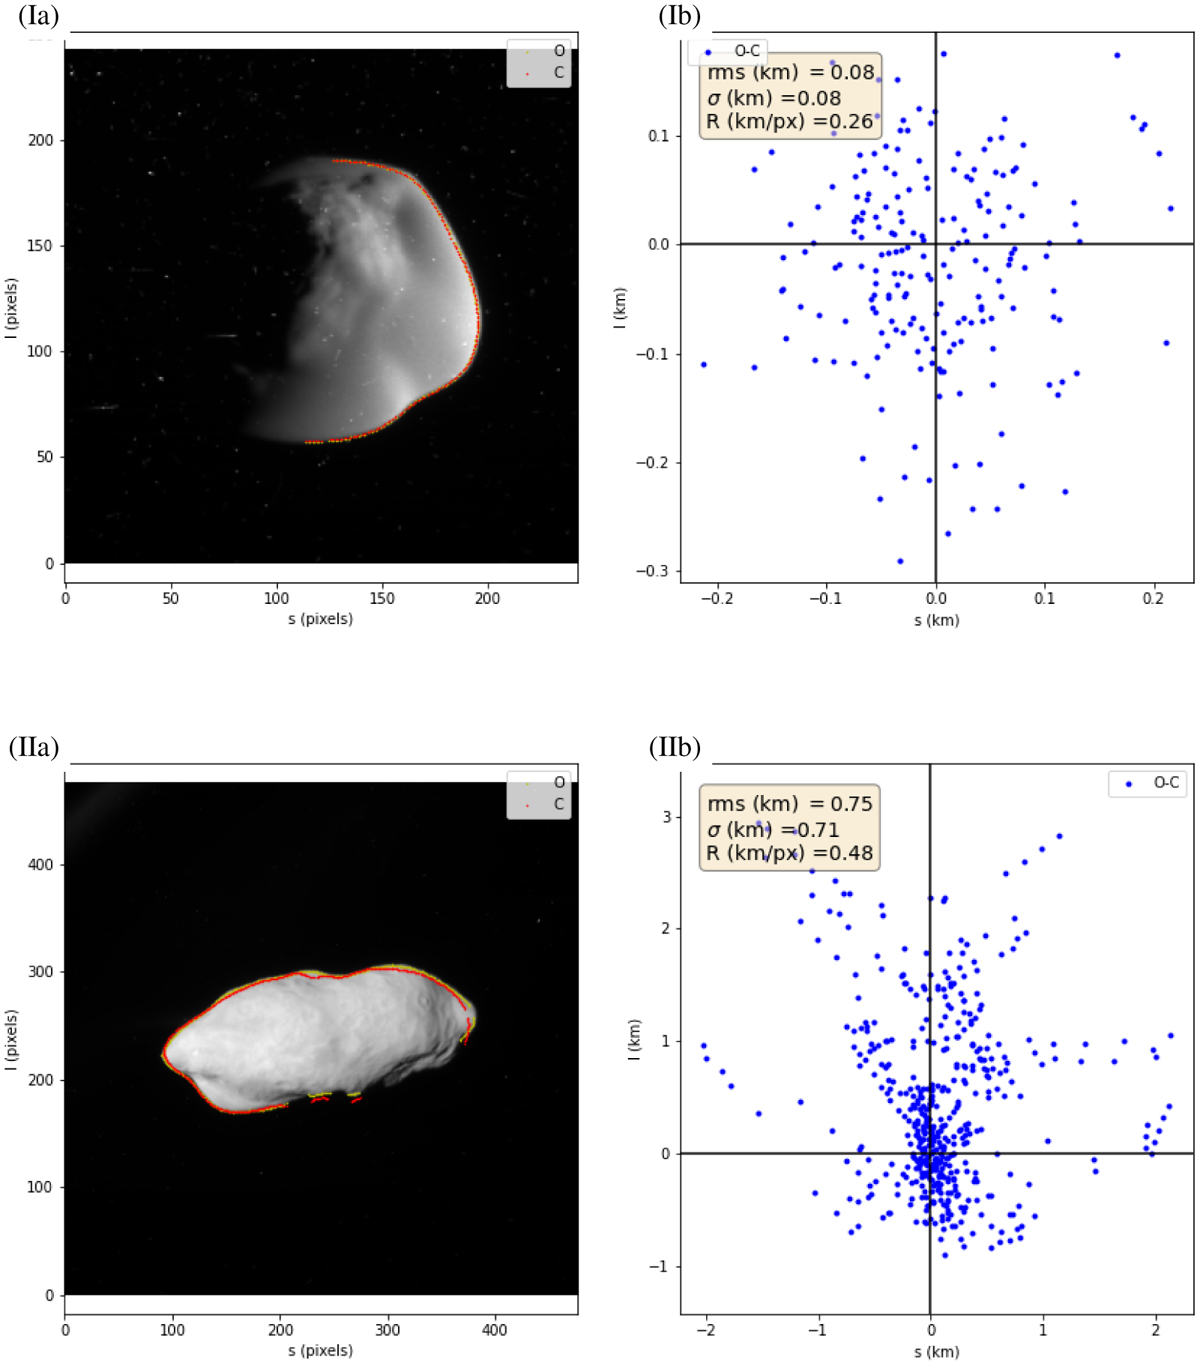
Limb measurements for Atlas (Ia) and Prometheus (IIa). The background is an image coming from ISS (N1560303820 for Atlas and N1640506063 for Prometheus) and the yellow points represent the observed limb deduced from Caviar software and the red points are the shape model deduced from the SH analysis. The left panels (Ib) and (IIb) represent the residues between the observed limb and shape model expressed in kilometers. In the label, we note the root mean square (rms), the standard deviation σ and the scaling factor R.
Current usage metrics show cumulative count of Article Views (full-text article views including HTML views, PDF and ePub downloads, according to the available data) and Abstracts Views on Vision4Press platform.
Data correspond to usage on the plateform after 2015. The current usage metrics is available 48-96 hours after online publication and is updated daily on week days.
Initial download of the metrics may take a while.