Fig. 5
Download original image
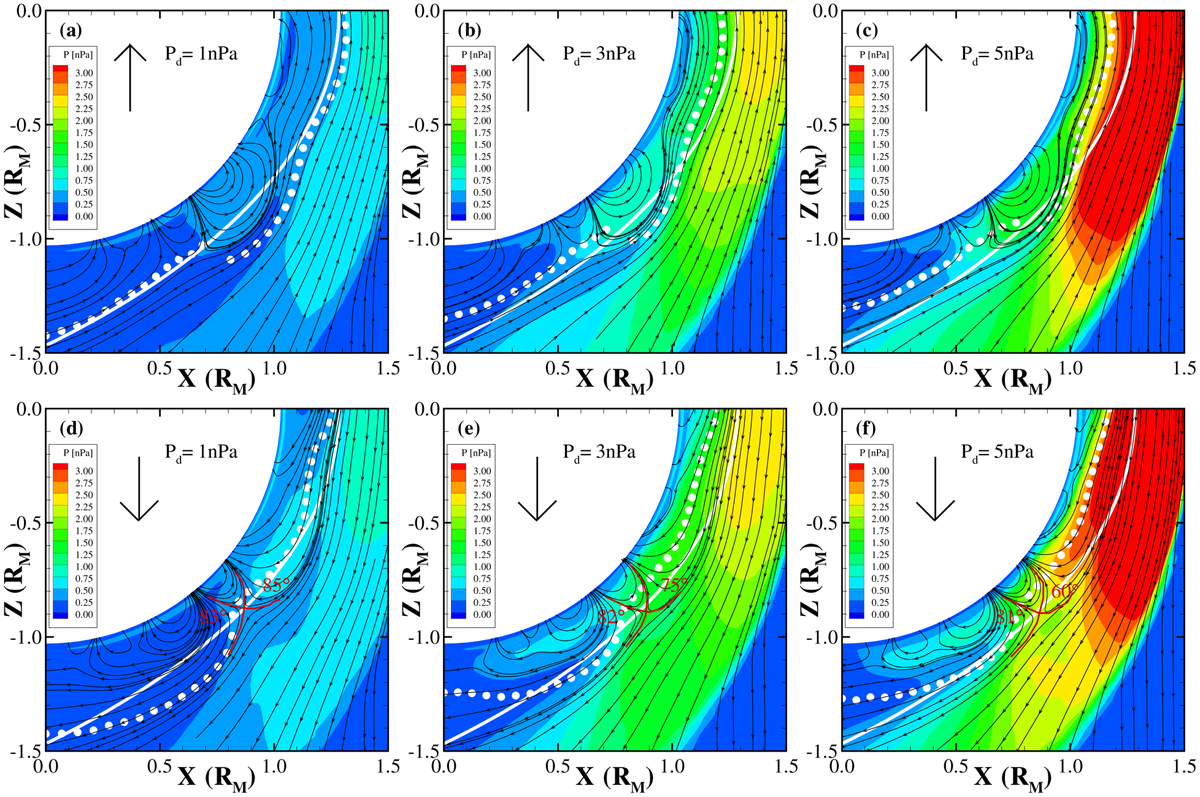
Solar wind dynamic pressure effect on the magnetic field topology in the southern hemisphere of the X–Z plane in the MSO coordinates under the northward and southward IMFs. The left, middle, and right panels stand for Pd = 1, 3, and 5 nPa, respectively; the upper and bottom panels represent the IMF conditions of BZ = 3 and −3 nT. The arrows indicate the upstream IMF direction, the black lines with arrows represent the magnetic field lines, the red lines describe the separatrix angles of the magnetic reconnection configurations, and the color bars show the solar wind thermal pressure. The locations of the Martian MPB (the white dots) are identified by the same method of Fig. 3; the white lines are the MPB model results of Vignes et al. (2000).
Current usage metrics show cumulative count of Article Views (full-text article views including HTML views, PDF and ePub downloads, according to the available data) and Abstracts Views on Vision4Press platform.
Data correspond to usage on the plateform after 2015. The current usage metrics is available 48-96 hours after online publication and is updated daily on week days.
Initial download of the metrics may take a while.