Free Access
Fig. 6
Download original image
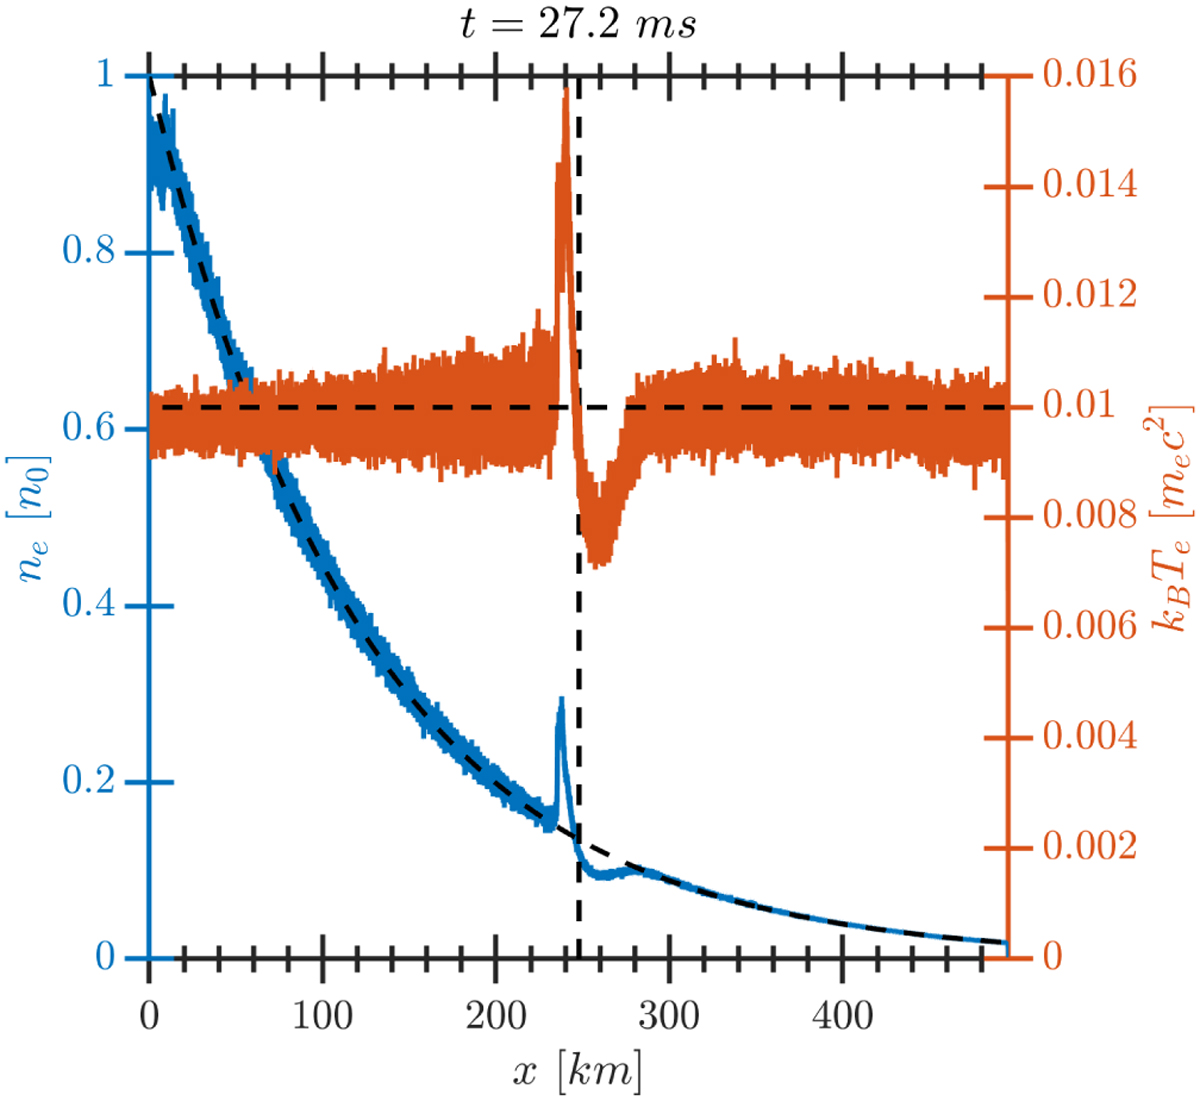
Electron number density (blue) and temperature along the x component (red) as a function of position at t = 0.027 s. Initial values are represented by the black dashed lines. The initial position of the DCBL where Bz = 0.5B0 is indicated by the vertical dashed line.
Current usage metrics show cumulative count of Article Views (full-text article views including HTML views, PDF and ePub downloads, according to the available data) and Abstracts Views on Vision4Press platform.
Data correspond to usage on the plateform after 2015. The current usage metrics is available 48-96 hours after online publication and is updated daily on week days.
Initial download of the metrics may take a while.