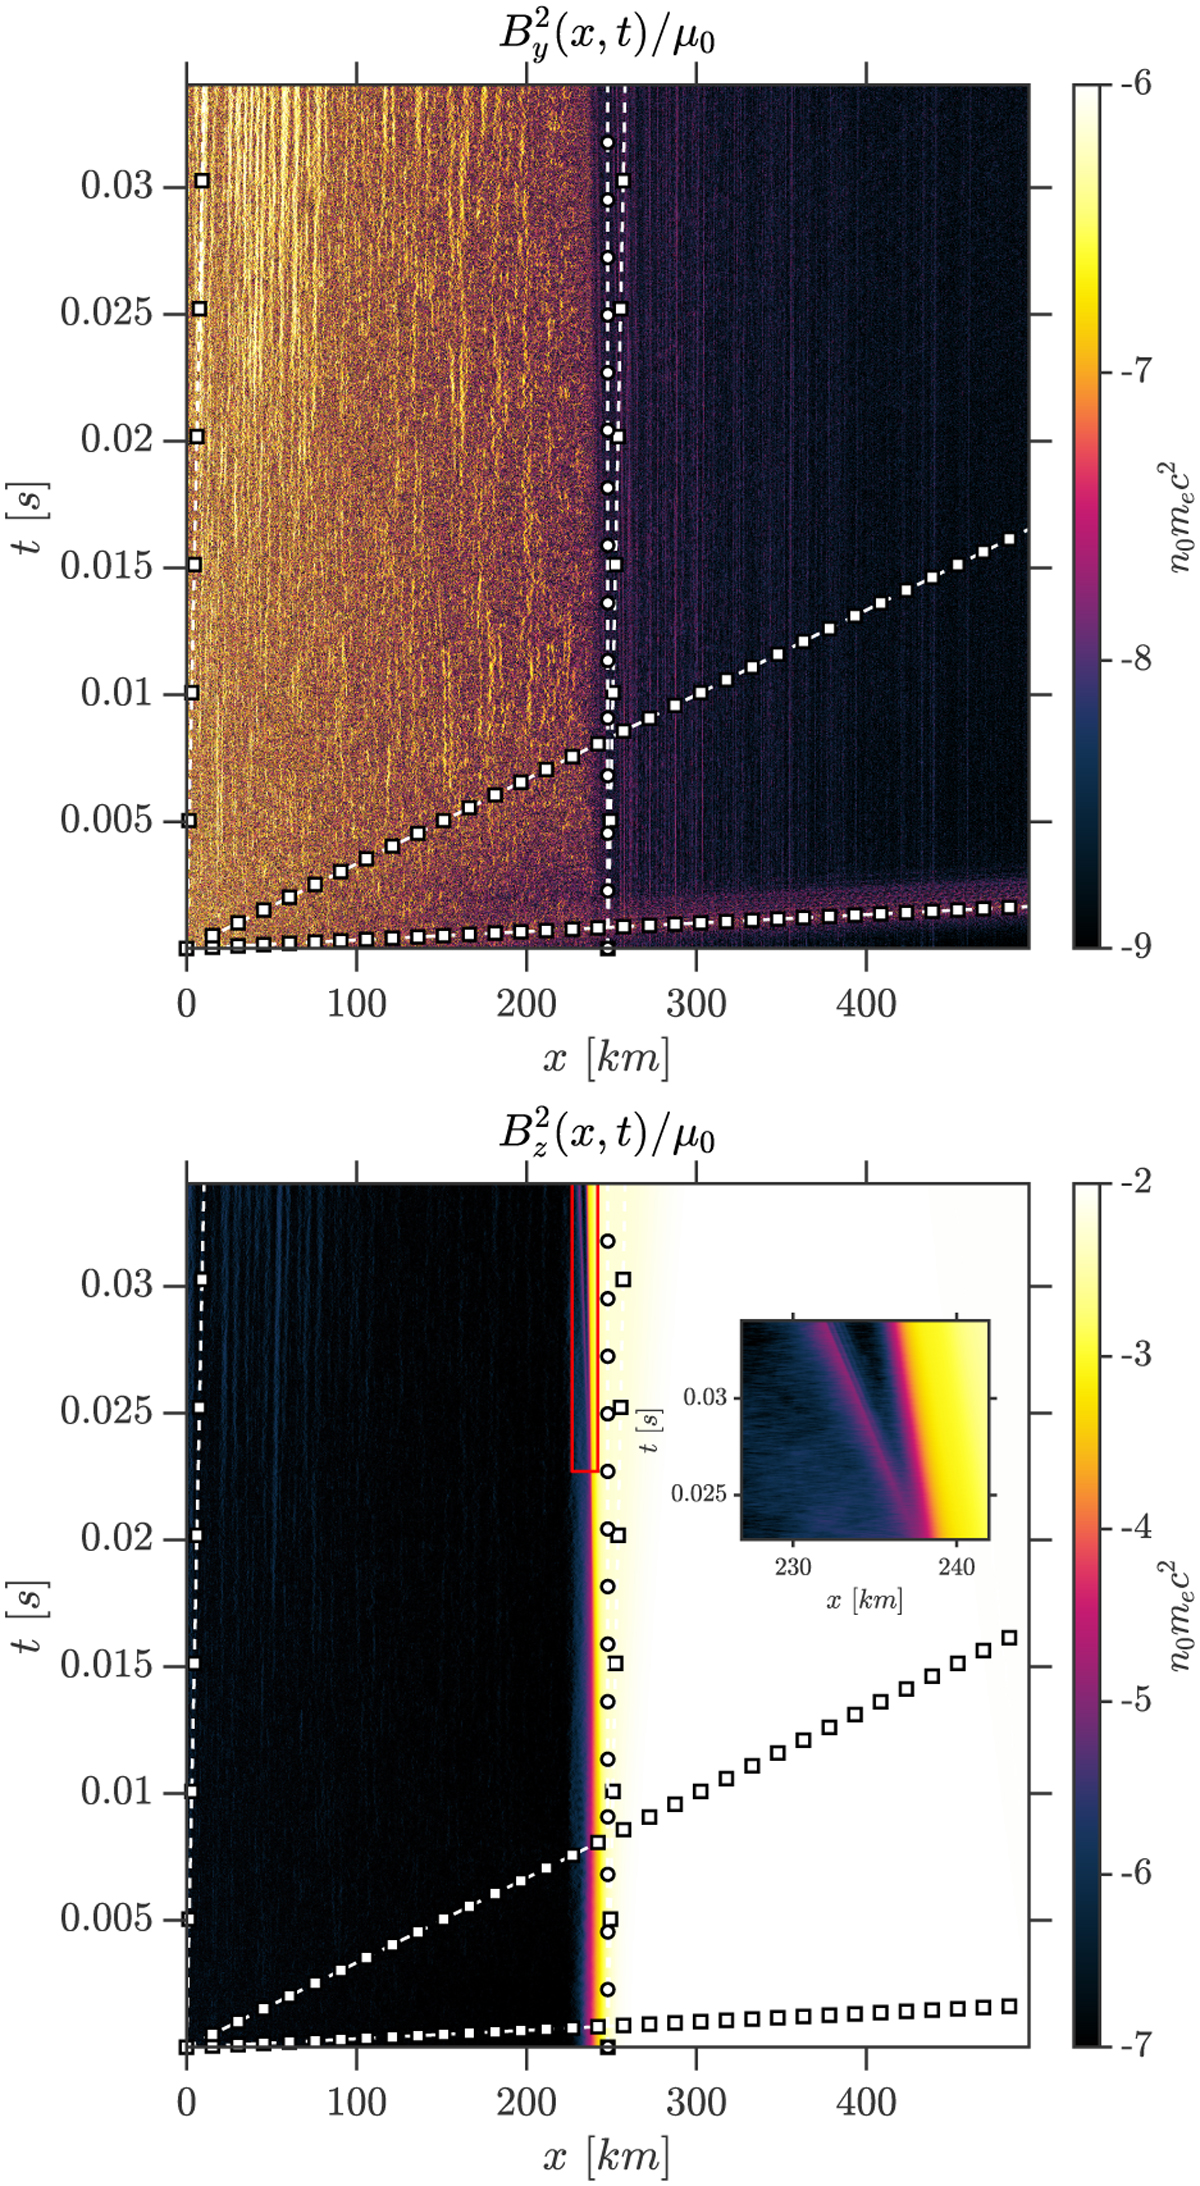
Fig. 4
Download original image
Colour plot (position vs. time) of the energy stored in the different magnetic field components. Due to the symmetry, Bx is null. As an indication, lines with squares represent the propagation of structures at different speeds. The inset is a zoom of the red box along the boundary. The colour bar is in logscale and SMILEI units (here n0mec2). Figure 2 provides further details of the labels.
Current usage metrics show cumulative count of Article Views (full-text article views including HTML views, PDF and ePub downloads, according to the available data) and Abstracts Views on Vision4Press platform.
Data correspond to usage on the plateform after 2015. The current usage metrics is available 48-96 hours after online publication and is updated daily on week days.
Initial download of the metrics may take a while.