Fig. 2
Download original image
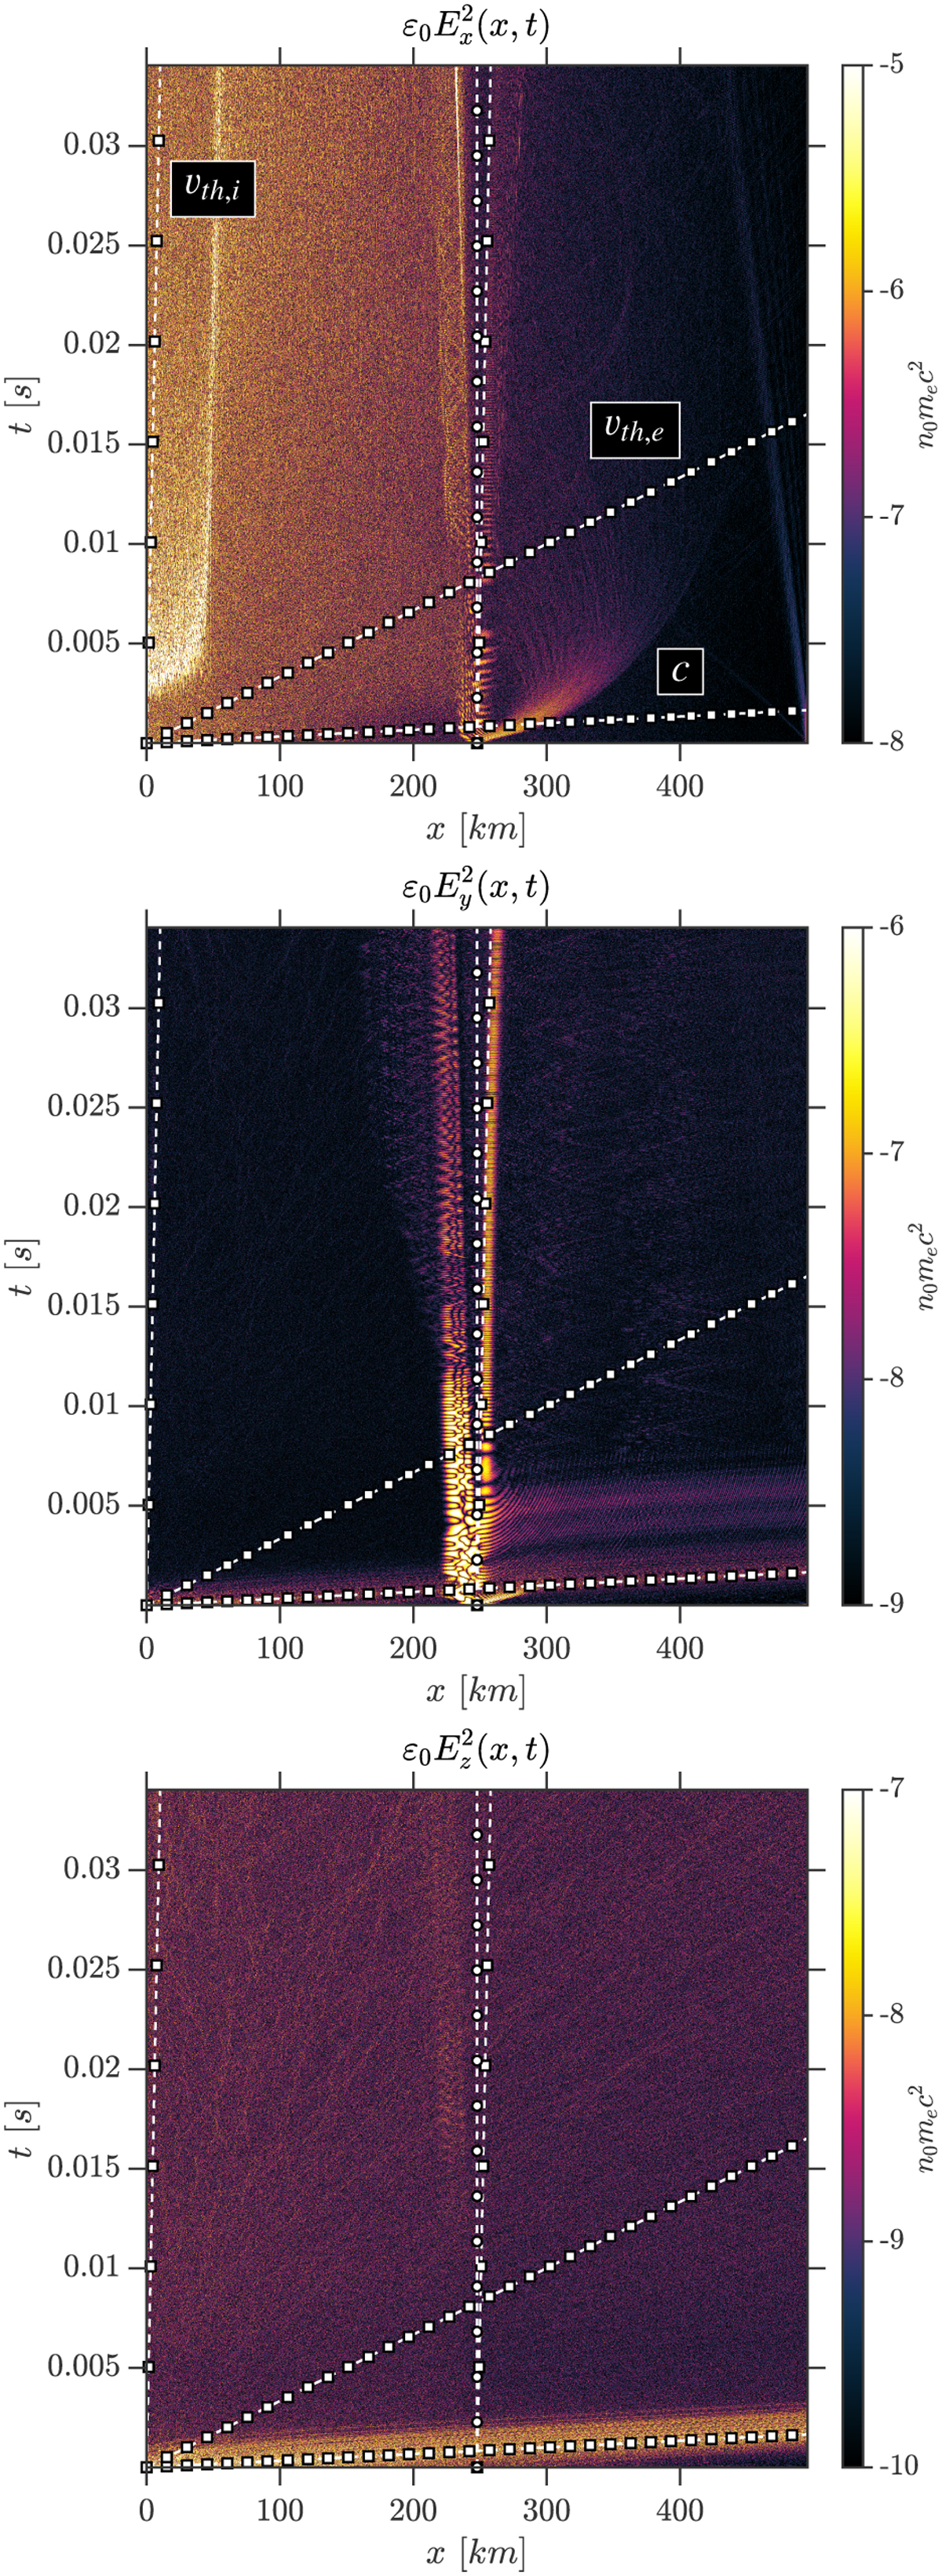
Colour plot (position vs. time) of the energy stored in the different electric field components. As an indication, lines with squares represent the propagation of structures at different speeds. From the most horizontal line to the most vertical one (with squares): speed of light in vacuum, thermal speed of the electrons ![]() , and ion acoustic speed
, and ion acoustic speed ![]() . The vertical line with circles is located at 0.5 Lbox, where Bz is originally B0/2. The colour bar is in logscale (different for each plot) and SMILEI units (here n0mec2).
. The vertical line with circles is located at 0.5 Lbox, where Bz is originally B0/2. The colour bar is in logscale (different for each plot) and SMILEI units (here n0mec2).
Current usage metrics show cumulative count of Article Views (full-text article views including HTML views, PDF and ePub downloads, according to the available data) and Abstracts Views on Vision4Press platform.
Data correspond to usage on the plateform after 2015. The current usage metrics is available 48-96 hours after online publication and is updated daily on week days.
Initial download of the metrics may take a while.