Fig. 10
Download original image
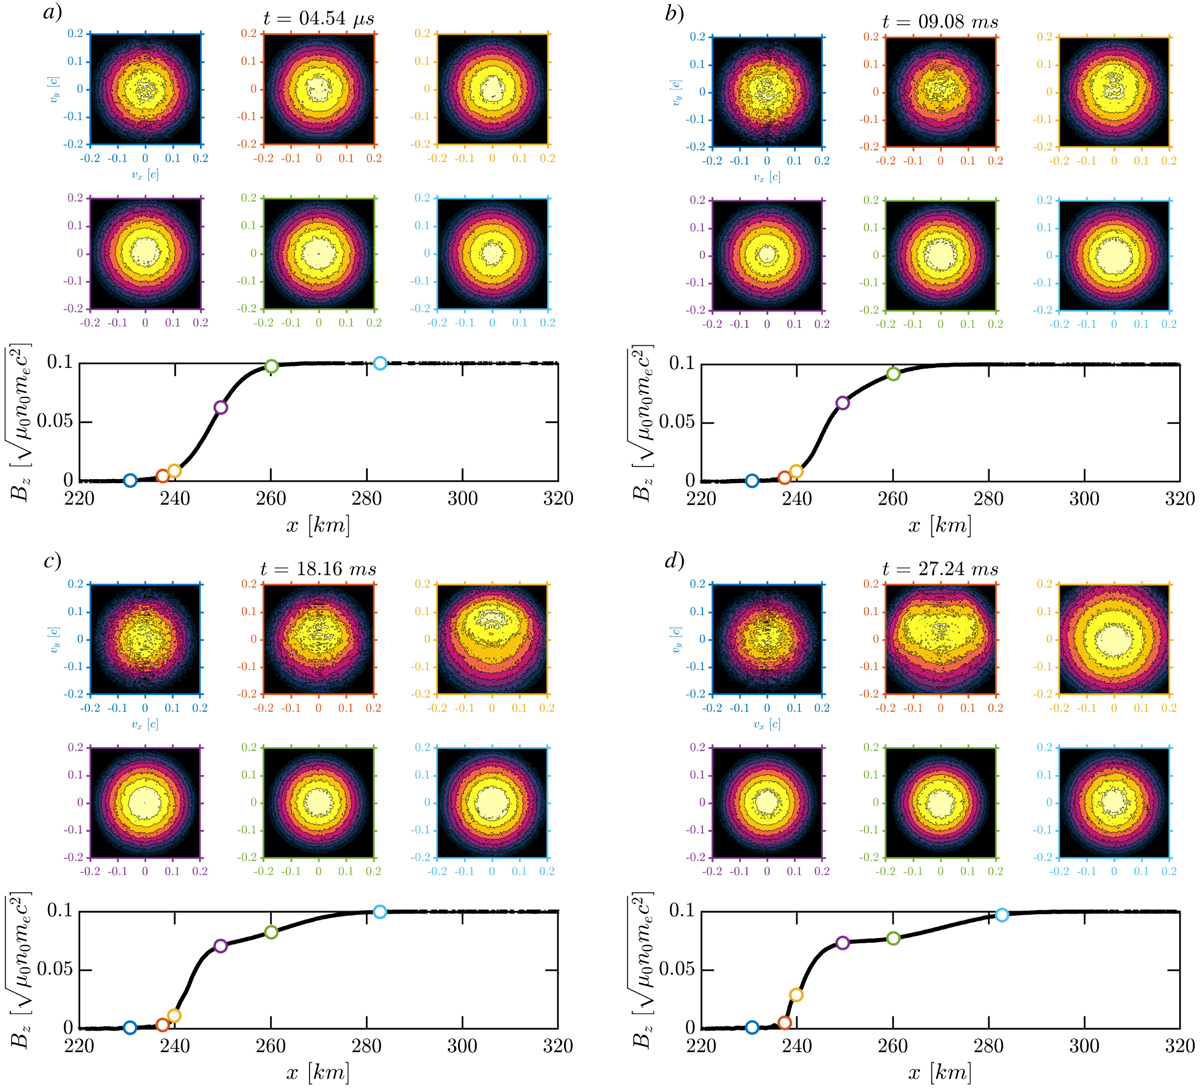
Evolution over time of the EVDF (the colour scale is in arbitrary units and therefore not indicated) in the plane perpendicular to the magnetic field in several locations through the DCBL; same as Fig. 9 but for different times. For each panel, the two top rows are EVDFs which have been sampled between −0.2c and 0.2c every 0.004c. No scales are provided as the purpose is only qualitative. Axis frames are of the same colour as markers indicating a specific location given in the bottom row overlayed on the magnetic field plot. Velocities (x and y axes of EVDFs) are given in terms of c. We performed a temporal average over the time interval [t0; t0 + 10 000∆t] with one sample every 100 ∆t. An animated version is available online.
Current usage metrics show cumulative count of Article Views (full-text article views including HTML views, PDF and ePub downloads, according to the available data) and Abstracts Views on Vision4Press platform.
Data correspond to usage on the plateform after 2015. The current usage metrics is available 48-96 hours after online publication and is updated daily on week days.
Initial download of the metrics may take a while.