Fig. 9.
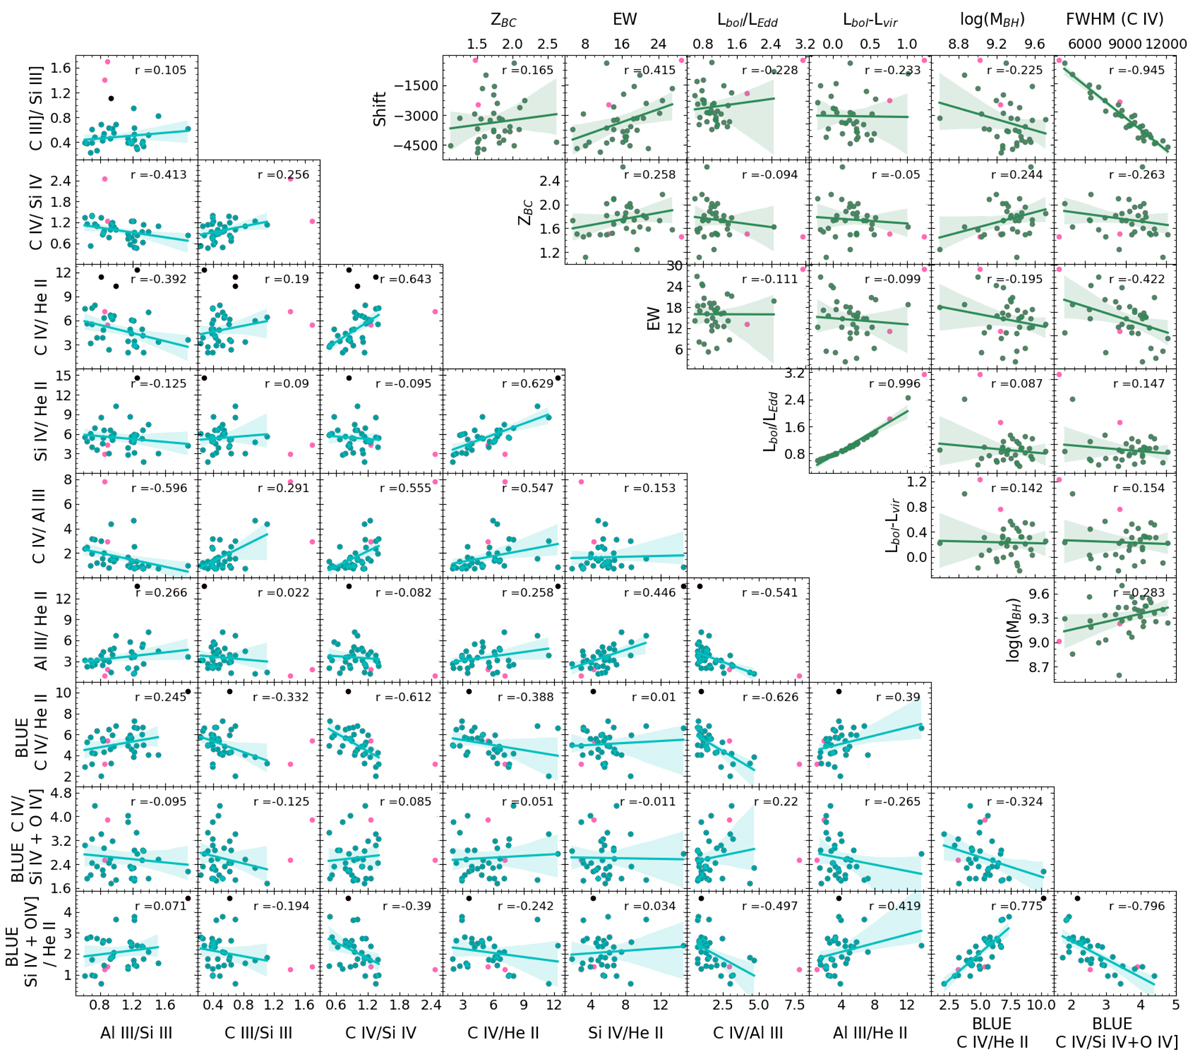
Download original image
Correlations between diagnostic ratios for the broad and BLUE components (left lower matrix), and between physical parameters (right upper matrix). The pink dots are the outlier sources described in Sect. 4.2 and were not considered in the statistical analysis. Additionally, for each panel we excluded, if necessary, the objects with the highest dispersion from the main relation (black dots). The blue and green dots are the values considered for each relation, the solid lines show the linear fit, the shaded areas represent the confidence interval of the lineal regression. For each relation the Spearman correlation coefficient (r) is shown in the right top corner.
Current usage metrics show cumulative count of Article Views (full-text article views including HTML views, PDF and ePub downloads, according to the available data) and Abstracts Views on Vision4Press platform.
Data correspond to usage on the plateform after 2015. The current usage metrics is available 48-96 hours after online publication and is updated daily on week days.
Initial download of the metrics may take a while.