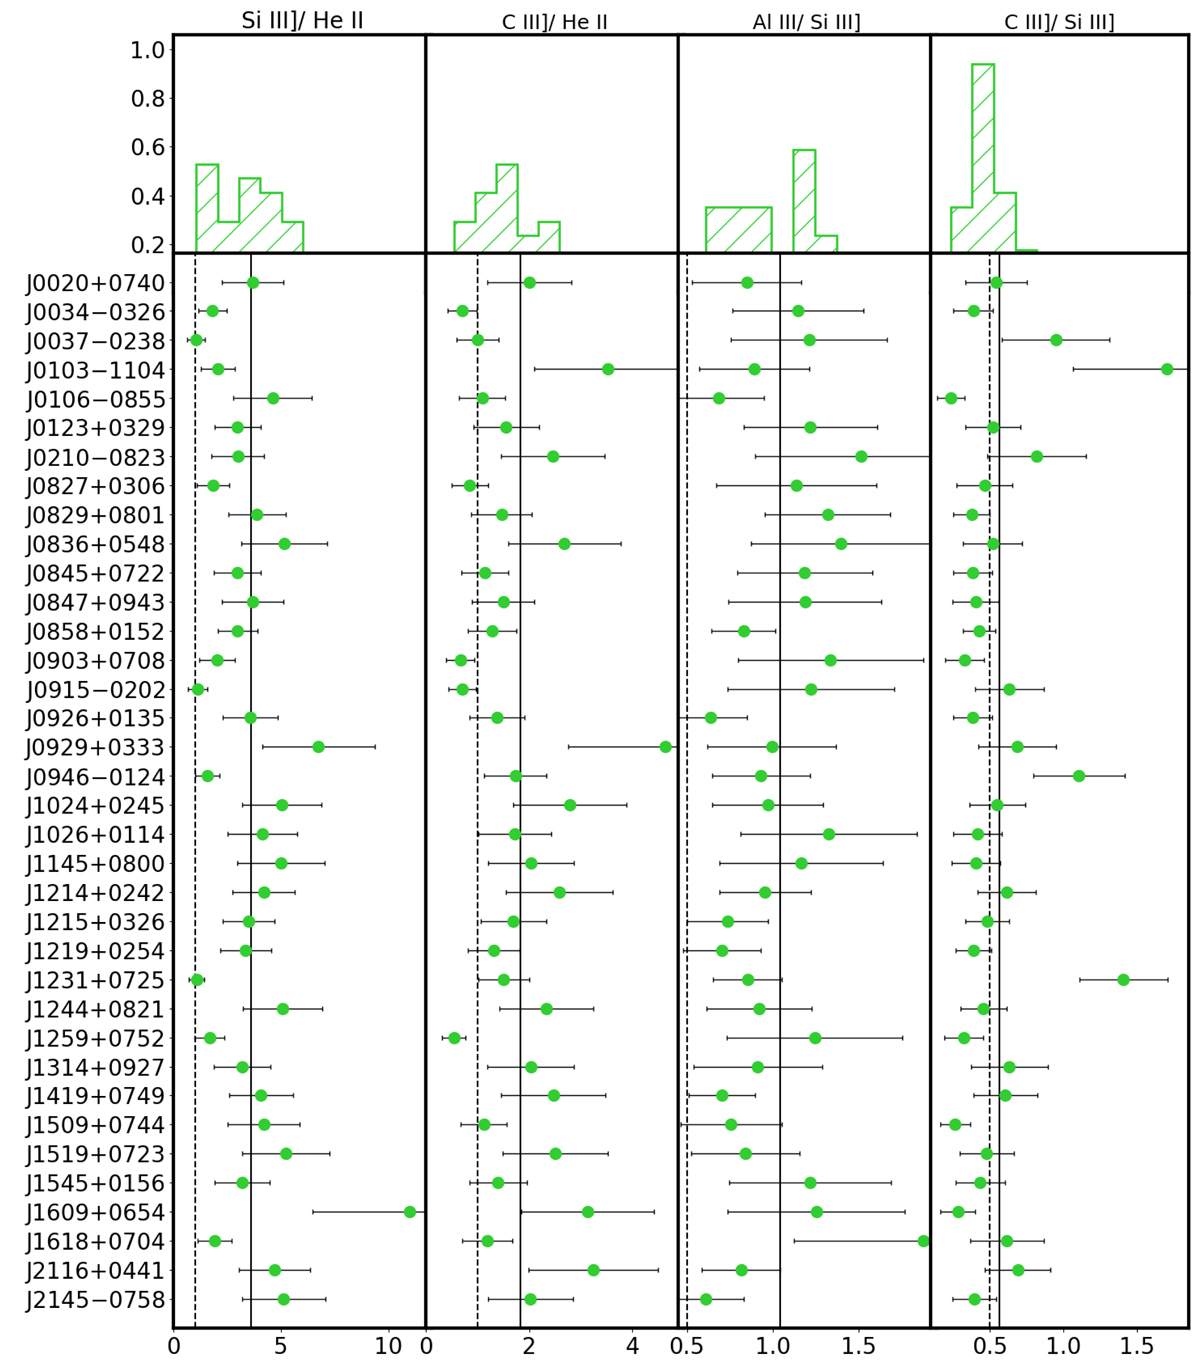
Fig. 5.
Download original image
Distribution (top) and individual (bottom) values of intensity ratios between prominent lines not used to estimate metallicity. The two panels on the right (AlIII/SiIII] and CIII]/SiIII]) show the ratios involved in the identification of xA sources. Vertical solid lines identify the mean value of the distribution. Dashed lines are set to 1 for the SiIII]/He II and CIII]/He II distributions, and 0.5 and 1.0 for the AlIII/SiIII] and CIII]/SiIII] distributions respectively, according to the UV selection criteria for the xA (Sect. 4.2).
Current usage metrics show cumulative count of Article Views (full-text article views including HTML views, PDF and ePub downloads, according to the available data) and Abstracts Views on Vision4Press platform.
Data correspond to usage on the plateform after 2015. The current usage metrics is available 48-96 hours after online publication and is updated daily on week days.
Initial download of the metrics may take a while.