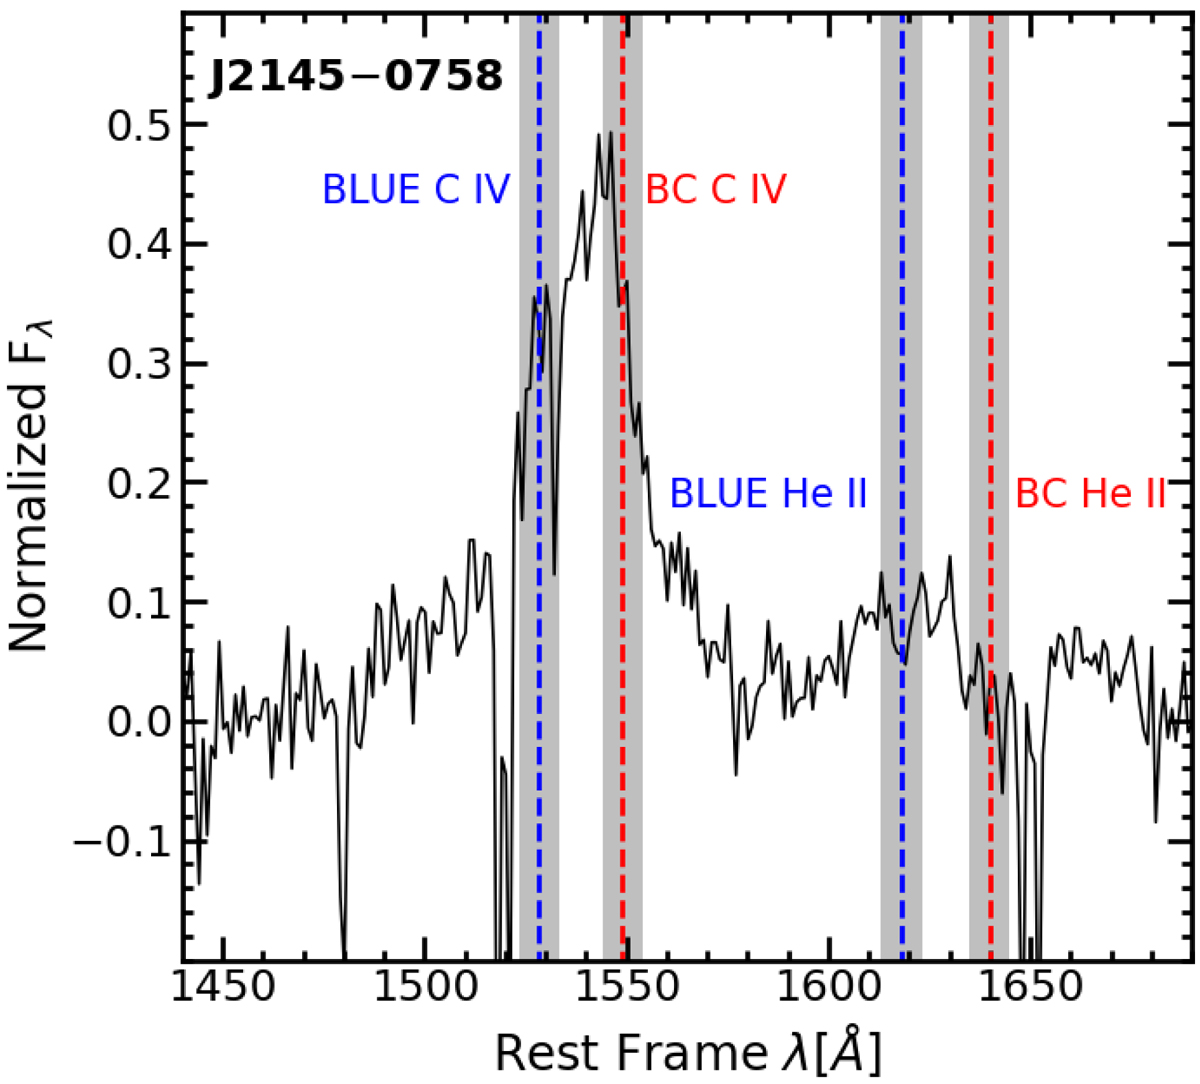
Fig. 4.
Download original image
Example of the 1550 Å region used for profile ratio measurements. The Figure shows in black the observed spectra minus the continuum. The red dashed lines indicate the rest frame wavelength of CIV and He II, the gray area surrounding these lines show the ±1000 km s−1 range of intensity measurement. The blue dashed lines indicate the BLUE emissions and are −4000 km s−1 from their broad component companion, the gray area surrounding these lines also show the ±1000 km s−1 range of measurement. Abscissa correspond to the rest frame wavelength in Å and ordinate normalized flux.
Current usage metrics show cumulative count of Article Views (full-text article views including HTML views, PDF and ePub downloads, according to the available data) and Abstracts Views on Vision4Press platform.
Data correspond to usage on the plateform after 2015. The current usage metrics is available 48-96 hours after online publication and is updated daily on week days.
Initial download of the metrics may take a while.