Fig. 2.
Download original image
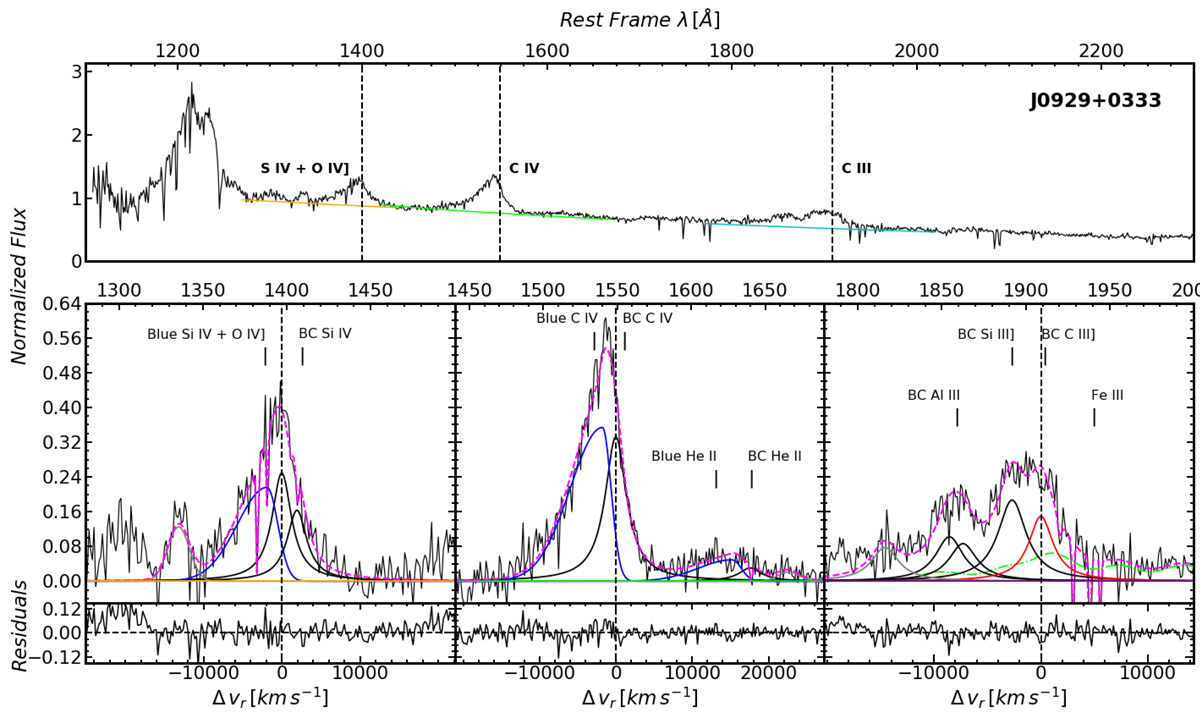
SDSS J092919.45+033303.4, with specfit analysis results. Top panel: full spectrum as a function of rest-frame wavelength, after normalization at 1350 Å. The actual continuum ranges employed in the fitting of the three spectral regions discussed in the paper are marked. Bottom panels: decomposition of the blends. Black lines: observed spectrum under continuum subtraction. Magenta dashed lines: full model of the observed spectrum. Thick black lines: BC of SiIV, CIV, HeIIλ1640, AlIII and SiIII]. Blue lines: blue-shifted components of SiIV + OIV], CIV and HeIIλ1640. Green line: FeIII(UV34) template. Red line: CIII] emission. Gray lines: faint lines affecting the blends or AlIII BLUE component.
Current usage metrics show cumulative count of Article Views (full-text article views including HTML views, PDF and ePub downloads, according to the available data) and Abstracts Views on Vision4Press platform.
Data correspond to usage on the plateform after 2015. The current usage metrics is available 48-96 hours after online publication and is updated daily on week days.
Initial download of the metrics may take a while.