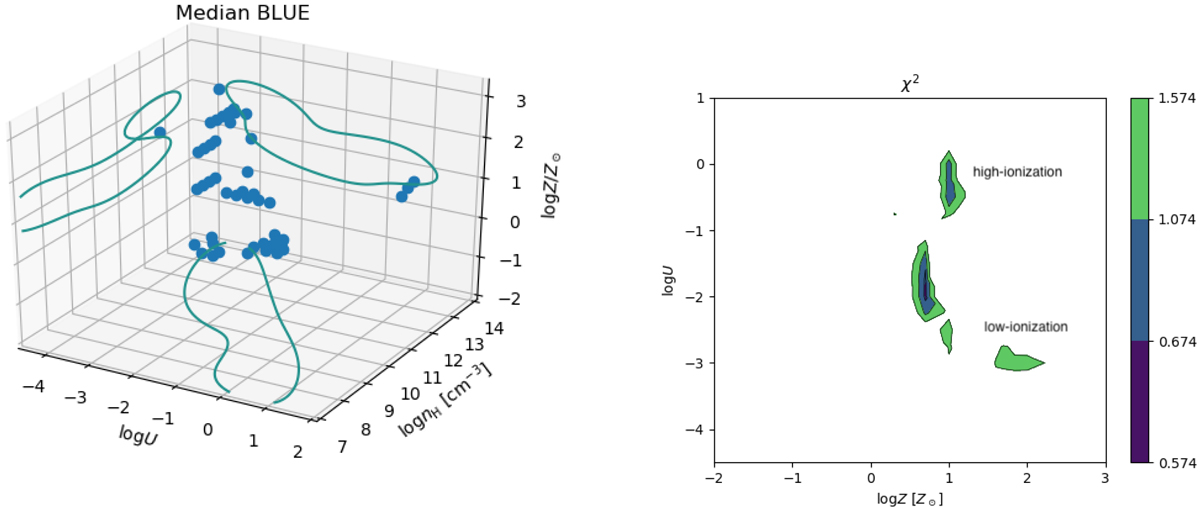
Fig. 13.
Download original image
Left: parameter space nH, U, Z, as in Fig. 12, but for component BLUE. As in that case, data points were computed from the emission line ratios referring to the median values in Table 6. The individual contour line was smoothed with a Gaussian kernel. Right: the plane log U vs. log Z. The outer isophotal contours delimit the region χmin + 1, where the χmin is the value after smoothing with a Gaussian filter. The low- and high-ionization solutions are marked.
Current usage metrics show cumulative count of Article Views (full-text article views including HTML views, PDF and ePub downloads, according to the available data) and Abstracts Views on Vision4Press platform.
Data correspond to usage on the plateform after 2015. The current usage metrics is available 48-96 hours after online publication and is updated daily on week days.
Initial download of the metrics may take a while.