Fig. 10.
Download original image
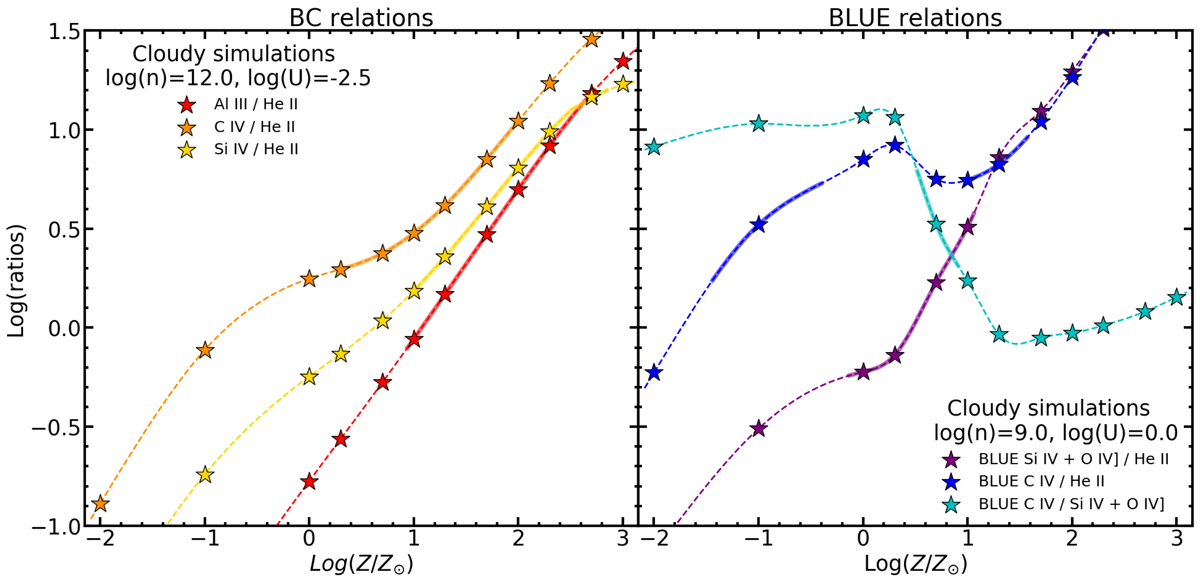
Intensity ratios trends predicted by CLOUDY as a function of the logarithm of the metallicity, for fixed physical parameters U and nH. Left panel: ratios of low/intermediate ionization potential BC lines. Right panel: ratios for high ionization potential emissions (BLUE components). In both panels, the stars represent the ratios predicted by CLOUDY. The dashed lines are the interpolation between the CLOUDY values obtained with a cubic spline, the thick solid line segments in each trend line show the range of line ratios covered by our sample, according to the measured flux ratios.
Current usage metrics show cumulative count of Article Views (full-text article views including HTML views, PDF and ePub downloads, according to the available data) and Abstracts Views on Vision4Press platform.
Data correspond to usage on the plateform after 2015. The current usage metrics is available 48-96 hours after online publication and is updated daily on week days.
Initial download of the metrics may take a while.