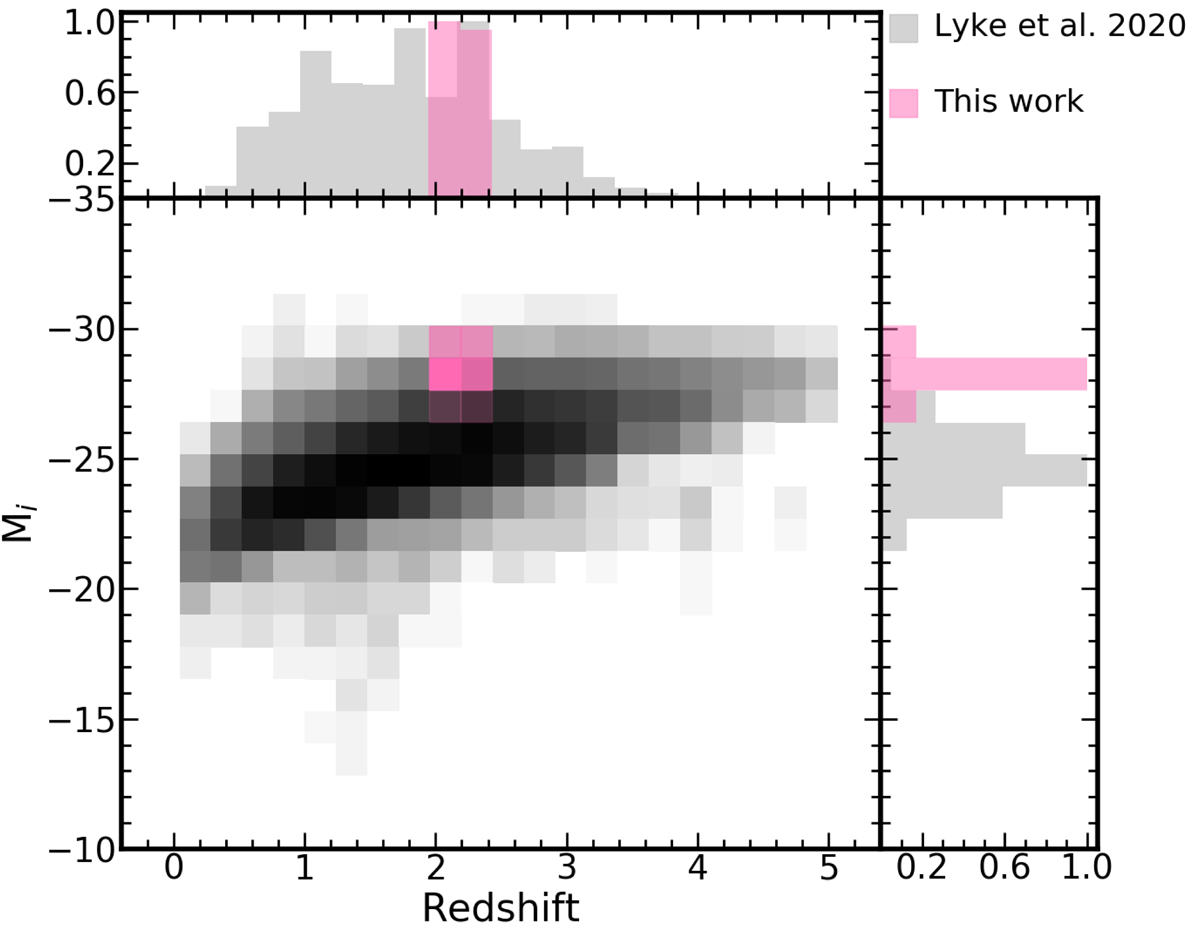
Fig. 1.
Download original image
Redshift distribution of the sample as a function of the absolute i-band magnitude Mi. The gray-scale squares show the Lyke et al. (2020) data, binned over small bins in z and Mi. The pink squares identify the sample used in this work. Upper panel: normalized redshift distribution. The pink histogram shows the corrected redshift adopted in this paper (see Sect. 3.1). Right panel: normalized absolute i-band magnitude distributions for both Lyke et al. (2020) and our sample.
Current usage metrics show cumulative count of Article Views (full-text article views including HTML views, PDF and ePub downloads, according to the available data) and Abstracts Views on Vision4Press platform.
Data correspond to usage on the plateform after 2015. The current usage metrics is available 48-96 hours after online publication and is updated daily on week days.
Initial download of the metrics may take a while.