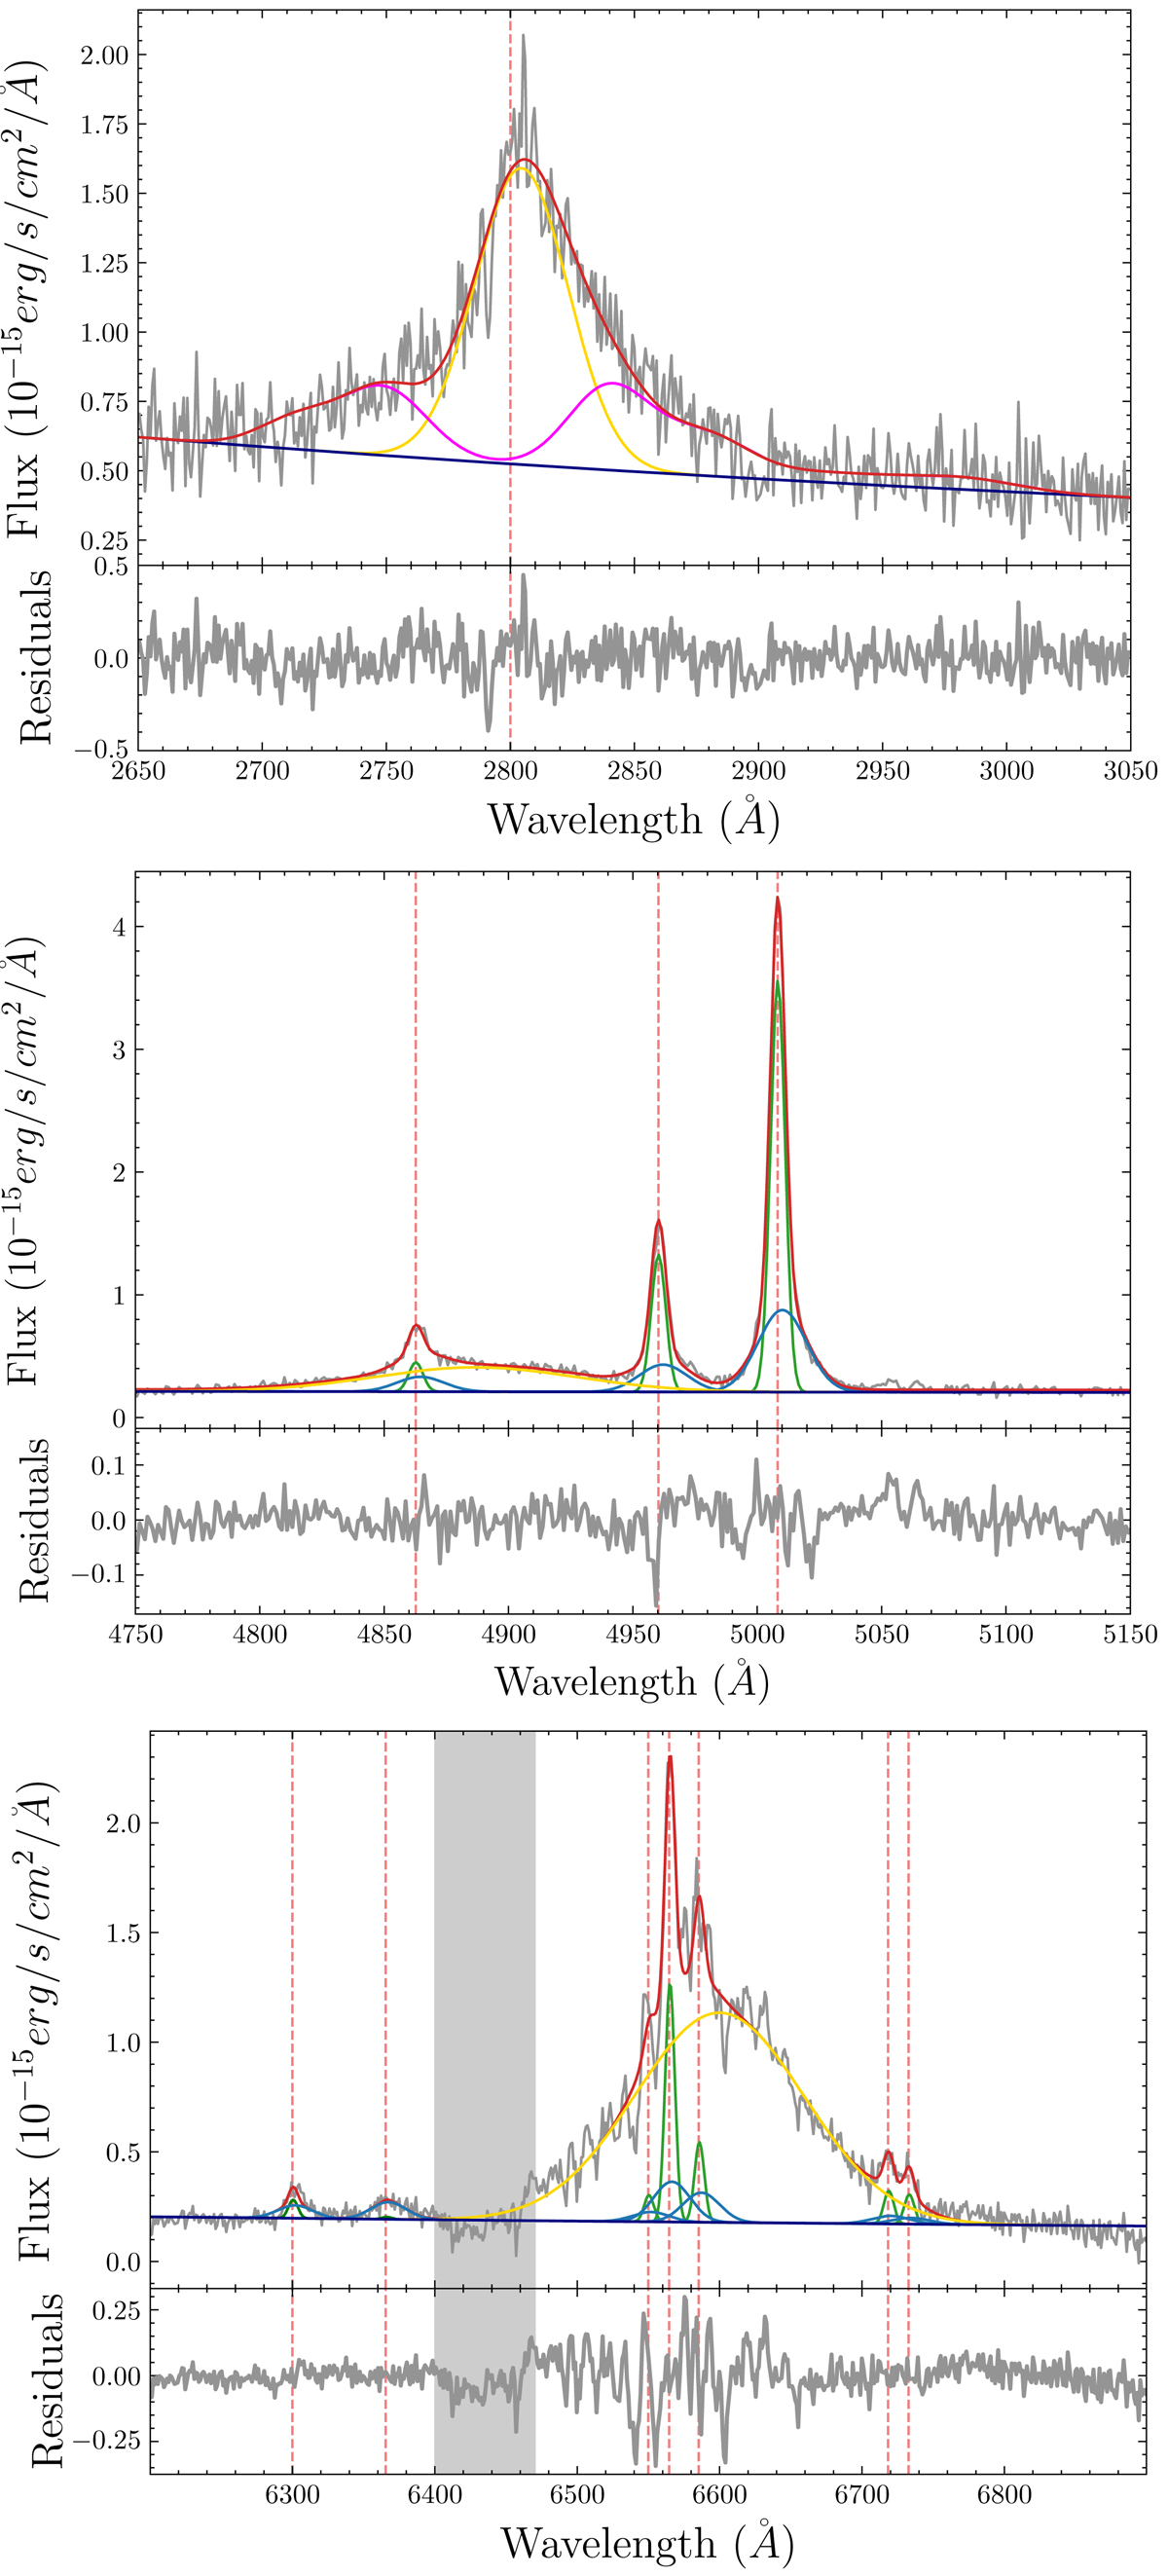
Fig. 9.
Download original image
Optical spectroscopy. (a) The MgII line spectrum, (b) Hβ-[OIII] region and (c) Hα-[SII] region. The red curves represent the best-fit models. Gold Gaussian components represent the emission originating from the BLR, the magenta curve refers to the iron emission and navy blue power-law curves represent the continuum emission. Green Gaussian components reproduce the NLR emission and blue ones trace the outflowing gas in the NLR. Dashed vertical red lines indicate the location of the emission lines of interest at the systemic redshift. The vertical grey shaded region marks the channels affected by telluric absorptions which were masked during the fitting procedure.
Current usage metrics show cumulative count of Article Views (full-text article views including HTML views, PDF and ePub downloads, according to the available data) and Abstracts Views on Vision4Press platform.
Data correspond to usage on the plateform after 2015. The current usage metrics is available 48-96 hours after online publication and is updated daily on week days.
Initial download of the metrics may take a while.