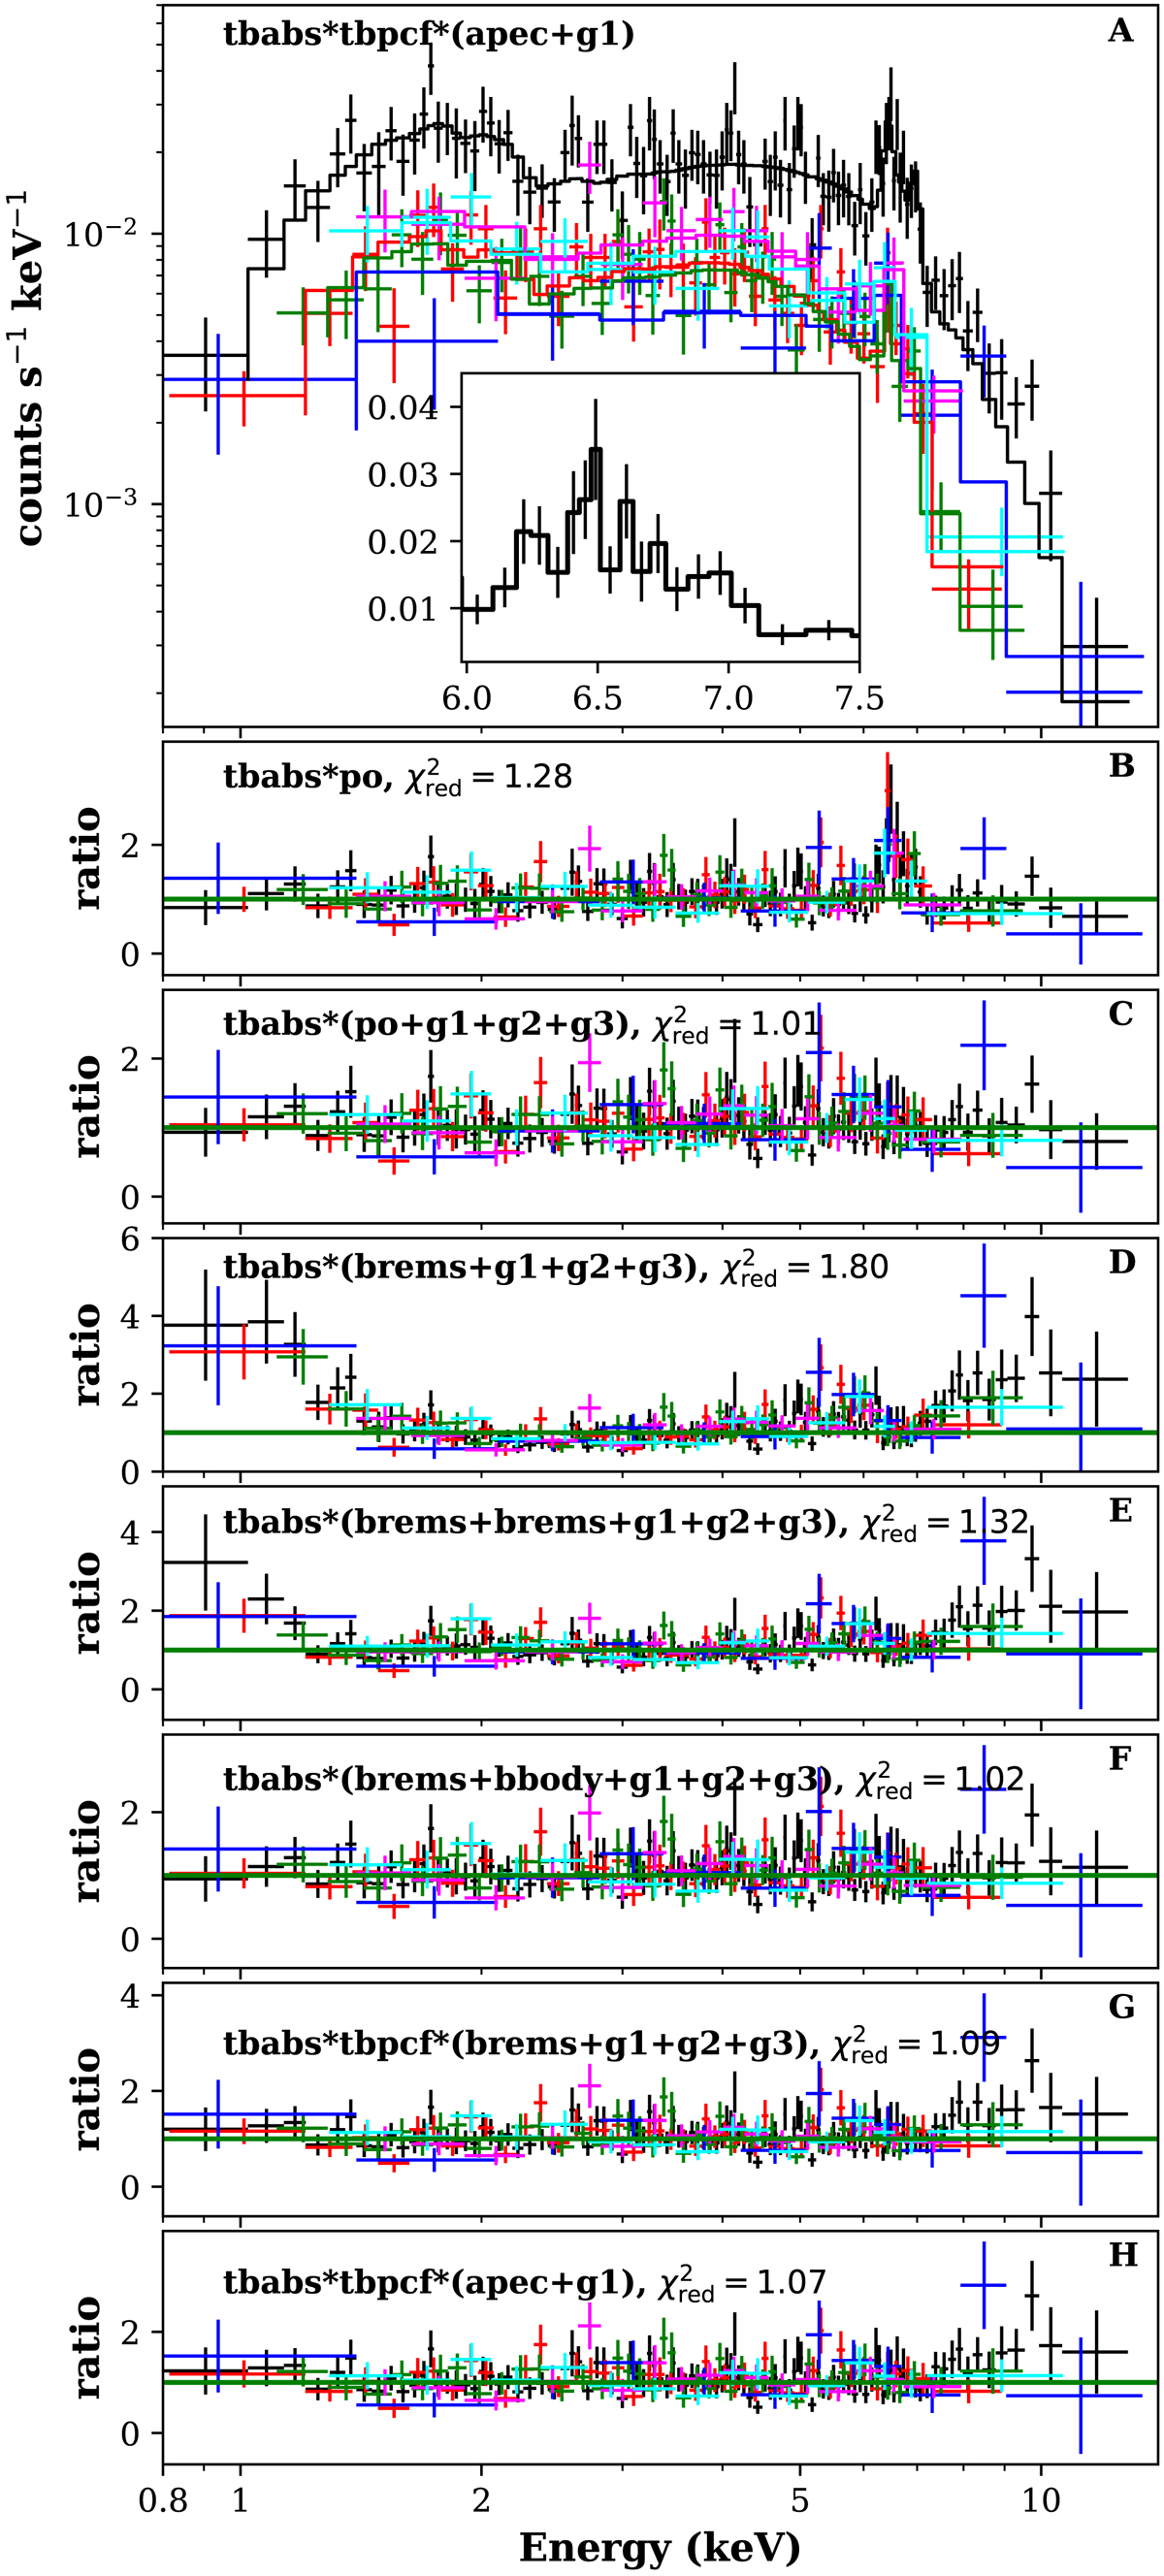
Fig. 1.
Download original image
Top panel: XMM-Newton time-averaged spectra fitted with a model tbabs*tbpcf*(apec+g1). The small insert in panel A shows the iron line complex in the 6–7.5 keV region for the EPIC-pn detector of ObsID: 0886010601. The bottom panels show the data-to-model ratio plot obtained from different model fits. The black, red, green, blue, magenta, and cyan data points are from EPIC-pn, MOS1, and MOS2 detectors of ObsID: 0886010601 and 0823030101, respectively.
Current usage metrics show cumulative count of Article Views (full-text article views including HTML views, PDF and ePub downloads, according to the available data) and Abstracts Views on Vision4Press platform.
Data correspond to usage on the plateform after 2015. The current usage metrics is available 48-96 hours after online publication and is updated daily on week days.
Initial download of the metrics may take a while.