Fig. 2
Download original image
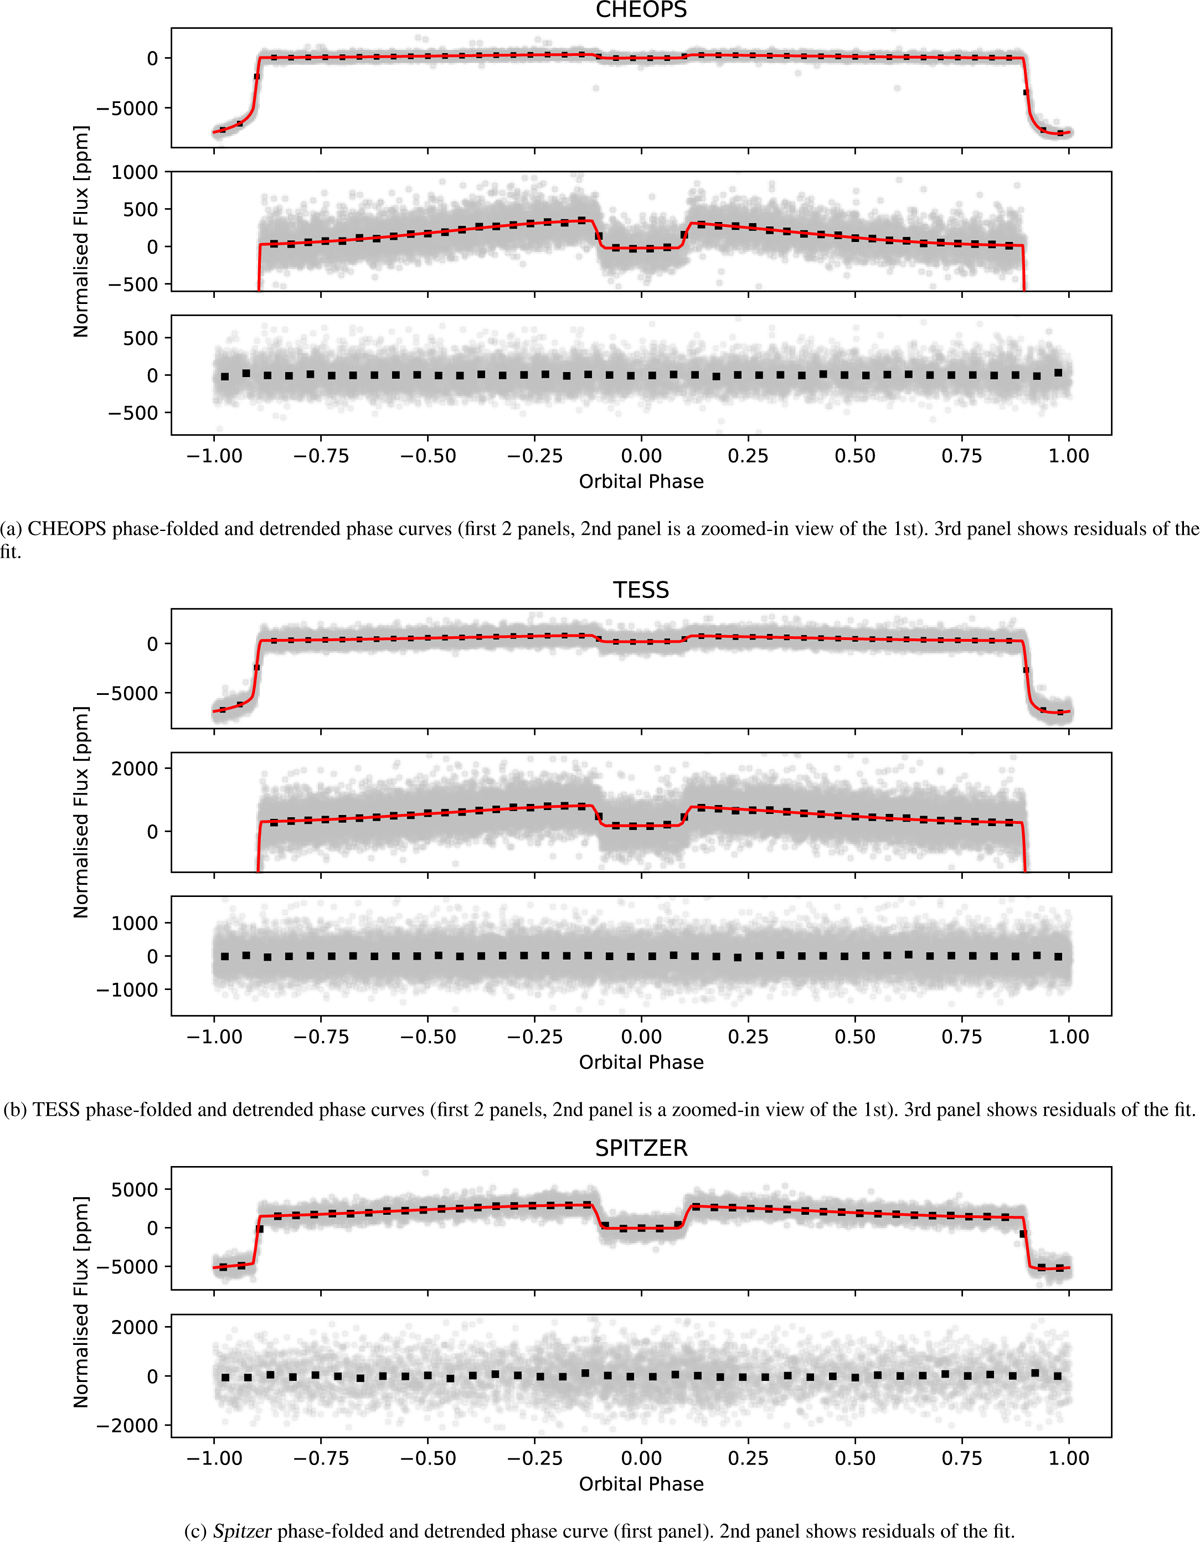
CHEOPS, TESS, and Spitzer phase-folded and detrended (stellar pulsations and other systematic trends removed) phase curves, overplotted with the best-fit phase curve model, transit model and eclipse model (in red). In black are the binned grey datapoints, with error bars that are smaller than the point size in all panels so they are not visible.
Current usage metrics show cumulative count of Article Views (full-text article views including HTML views, PDF and ePub downloads, according to the available data) and Abstracts Views on Vision4Press platform.
Data correspond to usage on the plateform after 2015. The current usage metrics is available 48-96 hours after online publication and is updated daily on week days.
Initial download of the metrics may take a while.