Open Access
Fig. B.1
Download original image
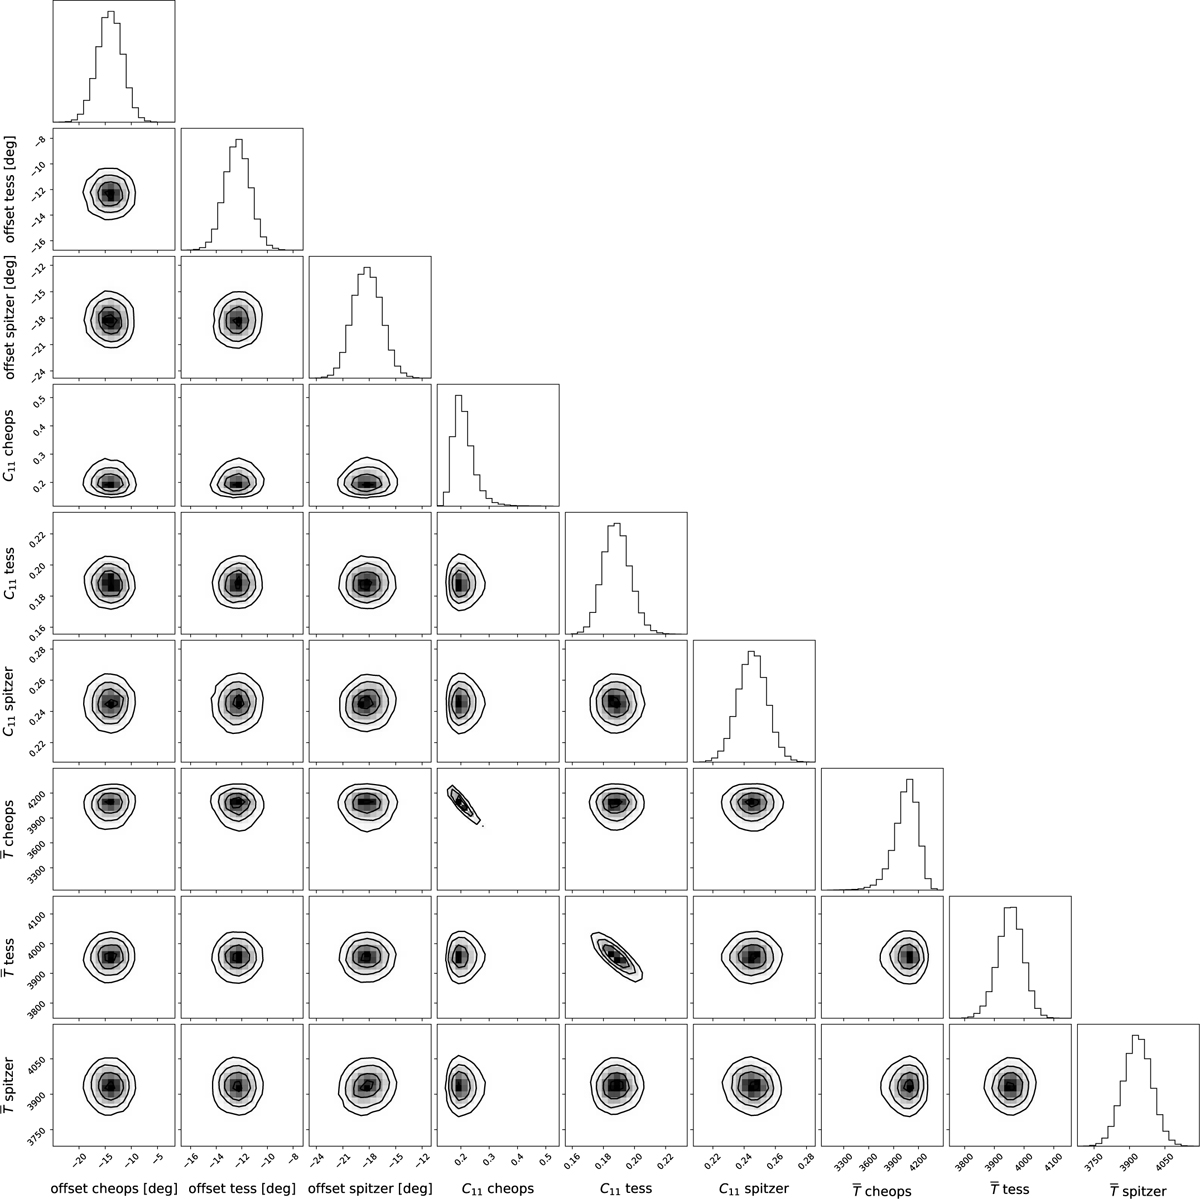
Corner plot showing posteriors of the phase curve parameters in the joint fit. The three contour lines in each subplot refer to the 1-, 2- and 3-sigma contour levels.
Current usage metrics show cumulative count of Article Views (full-text article views including HTML views, PDF and ePub downloads, according to the available data) and Abstracts Views on Vision4Press platform.
Data correspond to usage on the plateform after 2015. The current usage metrics is available 48-96 hours after online publication and is updated daily on week days.
Initial download of the metrics may take a while.