Open Access
Fig. 9.
Download original image
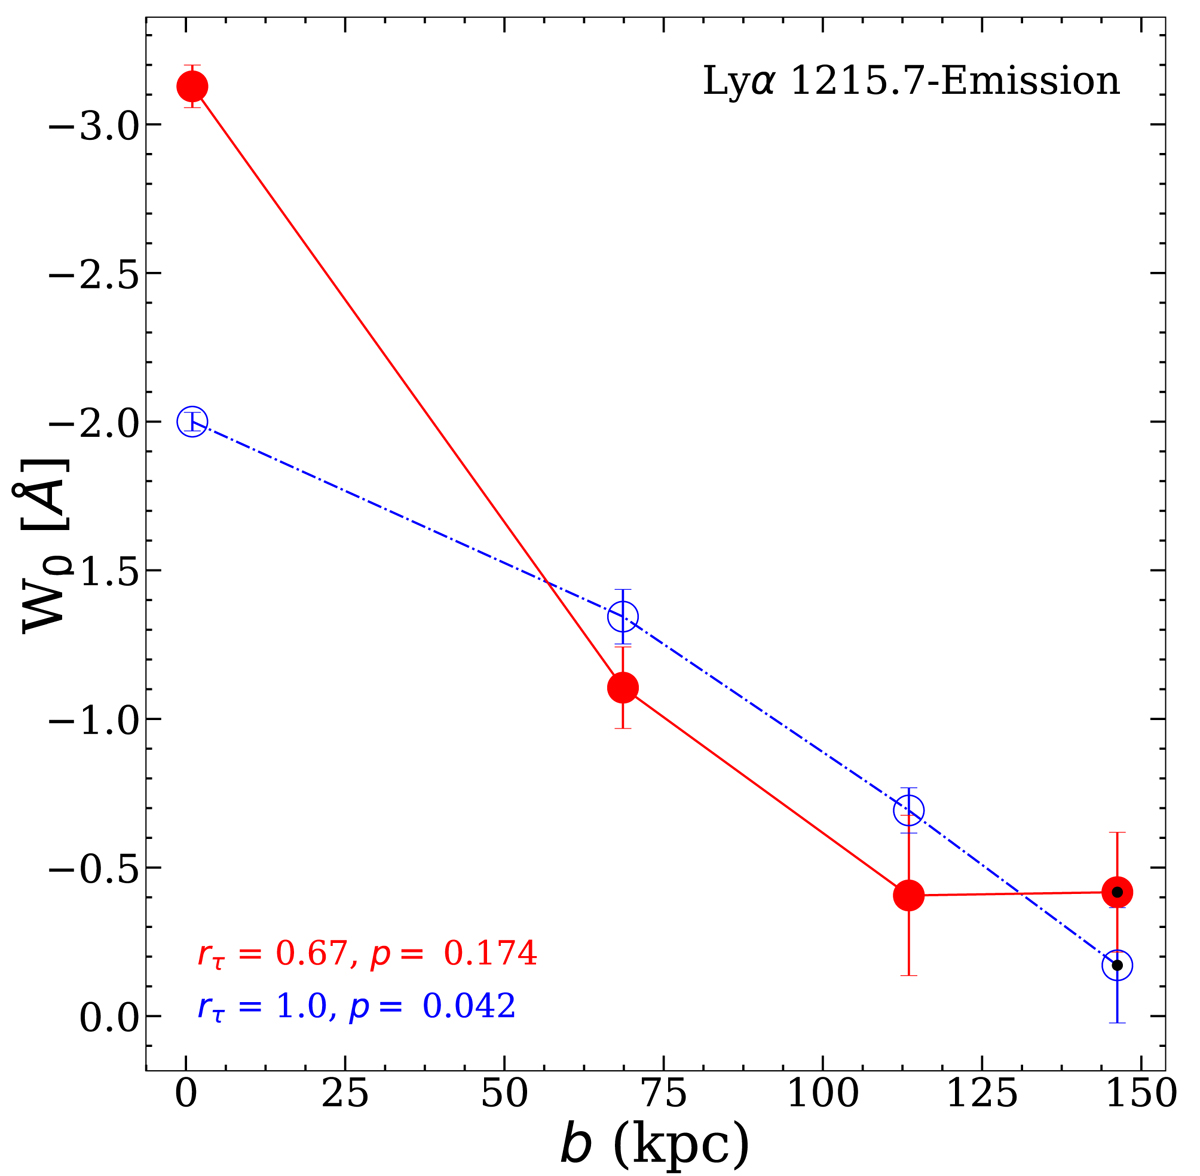
Equivalent width (W0) for the Lyα emission as a function of the impact parameter (b) obtained from the average (solid red line) and median (dot-dashed blue line) composite spectra. The error bars correspond to 1σ confidence intervals for average or median values based on a bootstrap analysis.
Current usage metrics show cumulative count of Article Views (full-text article views including HTML views, PDF and ePub downloads, according to the available data) and Abstracts Views on Vision4Press platform.
Data correspond to usage on the plateform after 2015. The current usage metrics is available 48-96 hours after online publication and is updated daily on week days.
Initial download of the metrics may take a while.