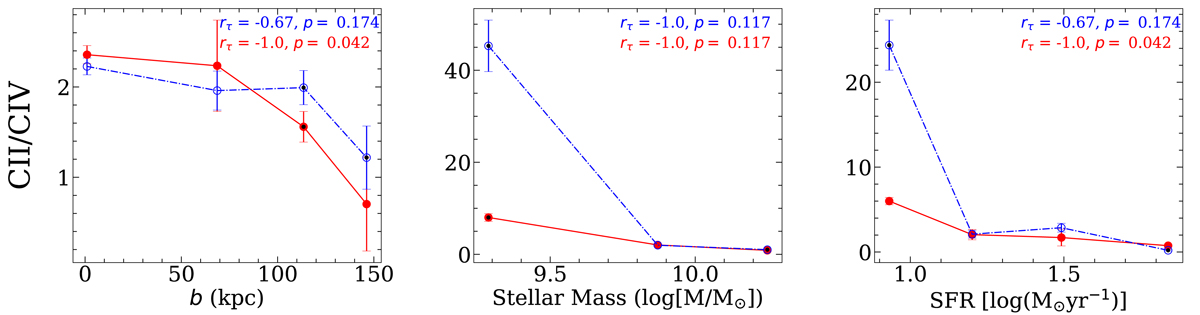
Fig. 8.
Download original image
CII/CIVW0 line ratio as a function of the impact parameter b, and the foreground galaxy’s stellar mass and SFR. CII/CIVW0 values were obtained considering the same set of fg–bg galaxy pairs. Average and median W0 are shown in solid red and open blue symbols; the solid black symbols correspond to upper limits with S/N < 3. The error bars correspond to 1σ confidence intervals for average or median values based on a bootstrap analysis.
Current usage metrics show cumulative count of Article Views (full-text article views including HTML views, PDF and ePub downloads, according to the available data) and Abstracts Views on Vision4Press platform.
Data correspond to usage on the plateform after 2015. The current usage metrics is available 48-96 hours after online publication and is updated daily on week days.
Initial download of the metrics may take a while.