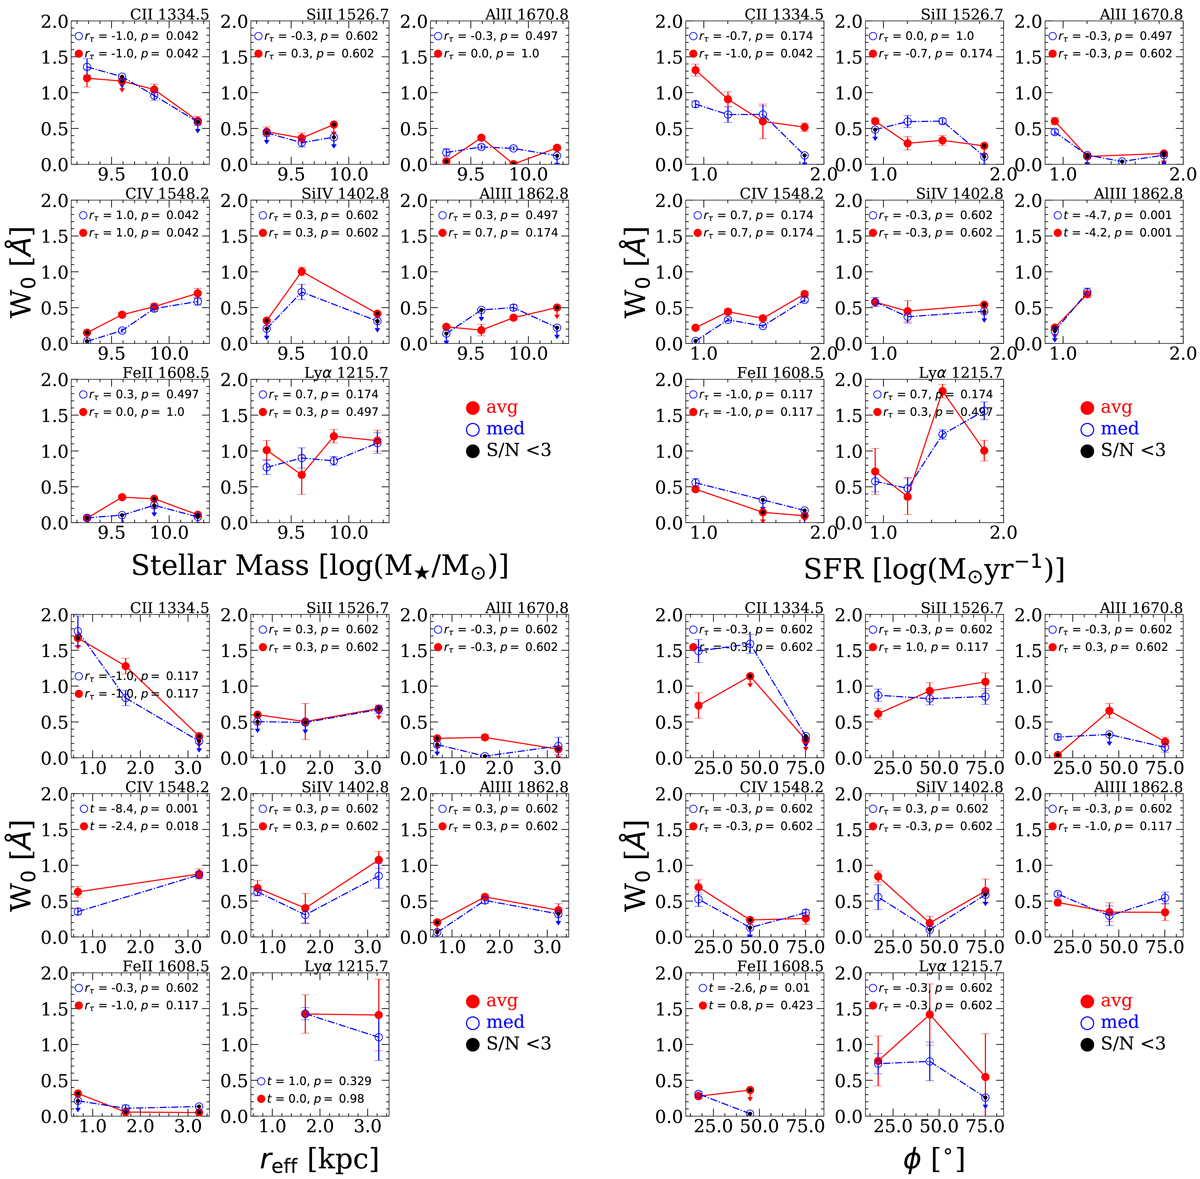
Fig. 7.
Download original image
Rest equivalent width (W0) of the absorption lines as a function of the foreground galaxy’s stellar mass (log[M⋆/M⊙]), SFR (log[M⊙ yr−1]), effective radius (reff), and azimuthal angle (ϕ). The W0 measurements come from composite spectra considering galaxy pairs at all projected distances (b < 23″) and split by the corresponding galaxy property. Stellar mass and SFR W0 were obtained from composite spectra considering 238 bg galaxies, while reff and ϕ come from composite spectra considering 97 bg galaxies (see Sect. 2 and Table 2). Average and median W0 are shown in solid red and open blue symbols; solid black symbols correspond to upper limits with S/N < 3. The error bars correspond to 1σ confidence intervals for average or median values based on a bootstrap analysis. The panels include the results from the Kendall-Tau correlation test: the correlation coefficients rτ and their corresponding p-value (the probability of no correlation). The panels of absorption lines with detections in only two subsamples also show the results from a Student’s t-test: the difference between a pair of mean values given by the t coefficient and their corresponding p-value (the probability of significant difference amongst means).
Current usage metrics show cumulative count of Article Views (full-text article views including HTML views, PDF and ePub downloads, according to the available data) and Abstracts Views on Vision4Press platform.
Data correspond to usage on the plateform after 2015. The current usage metrics is available 48-96 hours after online publication and is updated daily on week days.
Initial download of the metrics may take a while.