Fig. 6.
Download original image
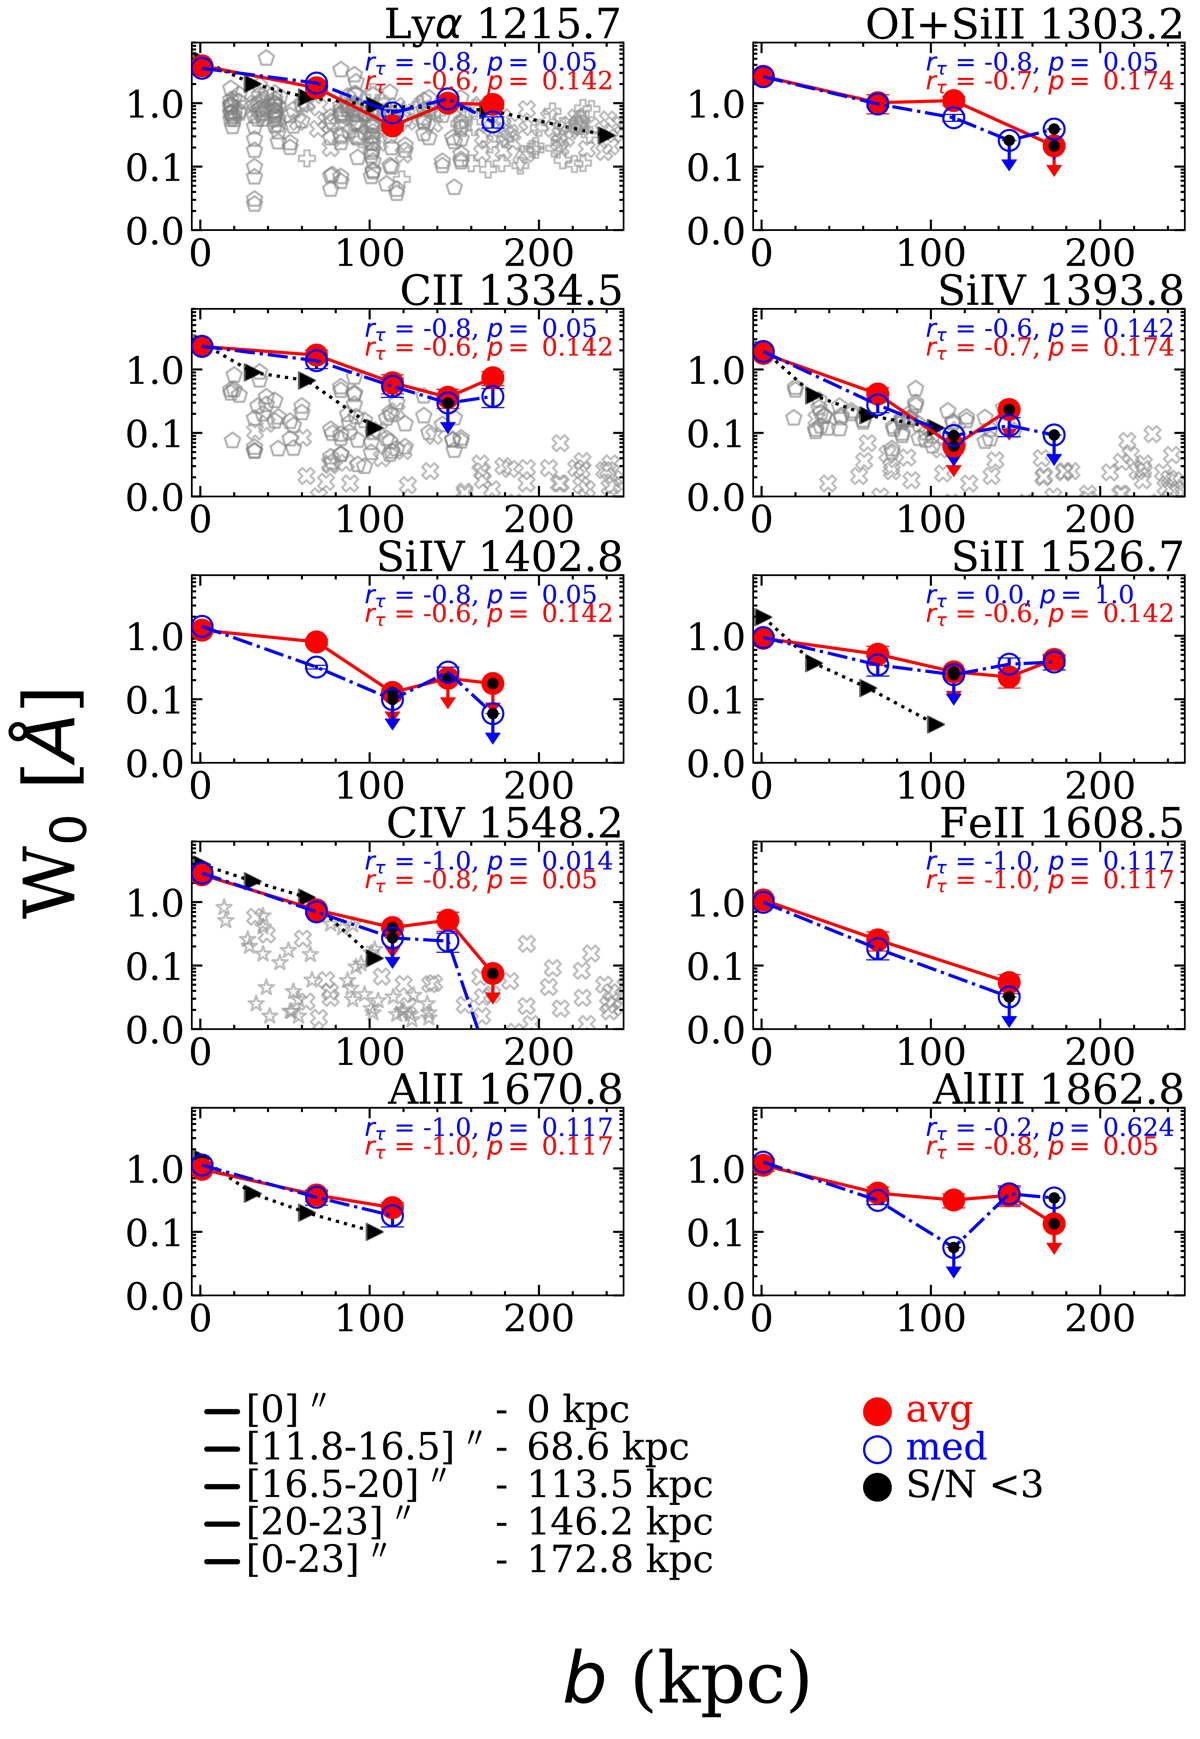
Rest equivalent width (W0) as a function of the impact parameter (b) obtained from the line profiles in Fig. 5, corresponding to the foreground composite spectra (0 kpc) and the background composite spectra at ⟨b⟩ = 68.6 kpc (8![]() 7), 113.5 kpc (14
7), 113.5 kpc (14![]() 4), 146.2 kpc (18
4), 146.2 kpc (18![]() 4), and 172.8 kpc (21
4), and 172.8 kpc (21![]() 5). Average and median W0 are respectively shown in filled red and open blue symbols; solid black symbols correspond to upper limits with S/N < 3. Reported values from the literature including low-redshift values (open grey symbols): (Bordoloi et al. 2018; stars), (Borthakur et al. 2015; pentagons), (Liang & Chen 2014; crosses), (Prochaska et al. 2011; diamonds), (Werk et al. 2013; pluses), and high-redshift values (Steidel et al. 2010; black triangles). The error bars correspond to 1σ confidence intervals for average (red filled circles) or median (blue open circles) values based on a bootstrap analysis. Also included are the results from the Kendall-Tau correlation test: the correlation coefficients rτ and the corresponding p-value (probability of no correlation).
5). Average and median W0 are respectively shown in filled red and open blue symbols; solid black symbols correspond to upper limits with S/N < 3. Reported values from the literature including low-redshift values (open grey symbols): (Bordoloi et al. 2018; stars), (Borthakur et al. 2015; pentagons), (Liang & Chen 2014; crosses), (Prochaska et al. 2011; diamonds), (Werk et al. 2013; pluses), and high-redshift values (Steidel et al. 2010; black triangles). The error bars correspond to 1σ confidence intervals for average (red filled circles) or median (blue open circles) values based on a bootstrap analysis. Also included are the results from the Kendall-Tau correlation test: the correlation coefficients rτ and the corresponding p-value (probability of no correlation).
Current usage metrics show cumulative count of Article Views (full-text article views including HTML views, PDF and ePub downloads, according to the available data) and Abstracts Views on Vision4Press platform.
Data correspond to usage on the plateform after 2015. The current usage metrics is available 48-96 hours after online publication and is updated daily on week days.
Initial download of the metrics may take a while.