Fig. 5.
Download original image
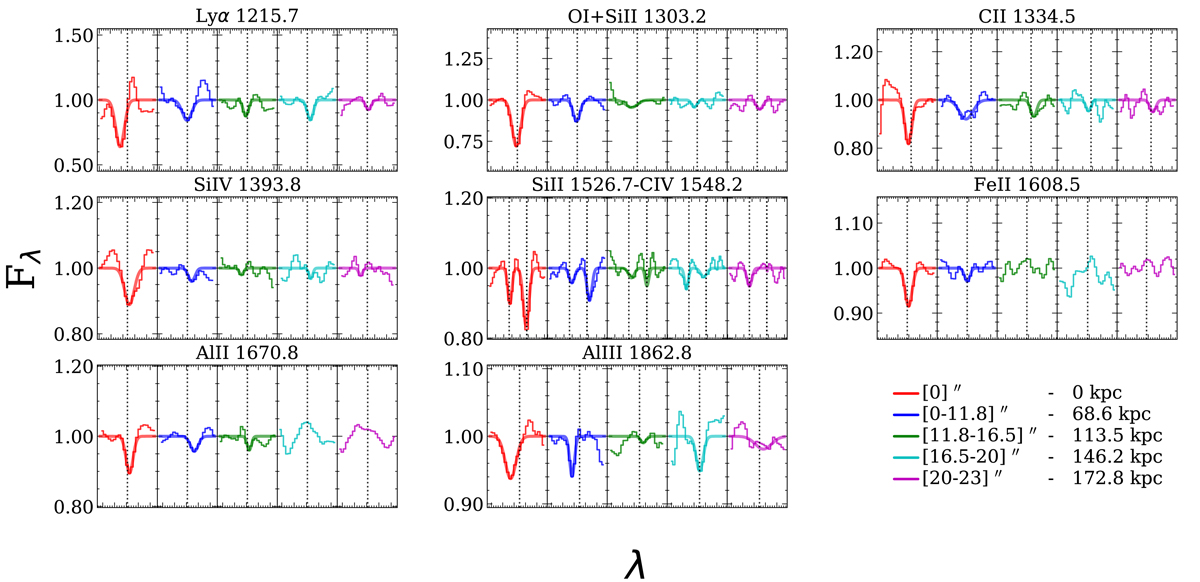
Median absorption lines (thin lines) detected from our 238 foreground–background galaxy pairs, including all foreground galaxies (red) and background galaxies split by their projected angular separations: < 11![]() 8 (blue), 11
8 (blue), 11![]() 8–16
8–16![]() 5 (green), 16
5 (green), 16![]() 5–20″ (cyan), and 20″–23″ (magenta). The bold lines indicate the Gaussian profile fit to measure the strength of the line absorptions (see Sect. 4.1).
5–20″ (cyan), and 20″–23″ (magenta). The bold lines indicate the Gaussian profile fit to measure the strength of the line absorptions (see Sect. 4.1).
Current usage metrics show cumulative count of Article Views (full-text article views including HTML views, PDF and ePub downloads, according to the available data) and Abstracts Views on Vision4Press platform.
Data correspond to usage on the plateform after 2015. The current usage metrics is available 48-96 hours after online publication and is updated daily on week days.
Initial download of the metrics may take a while.