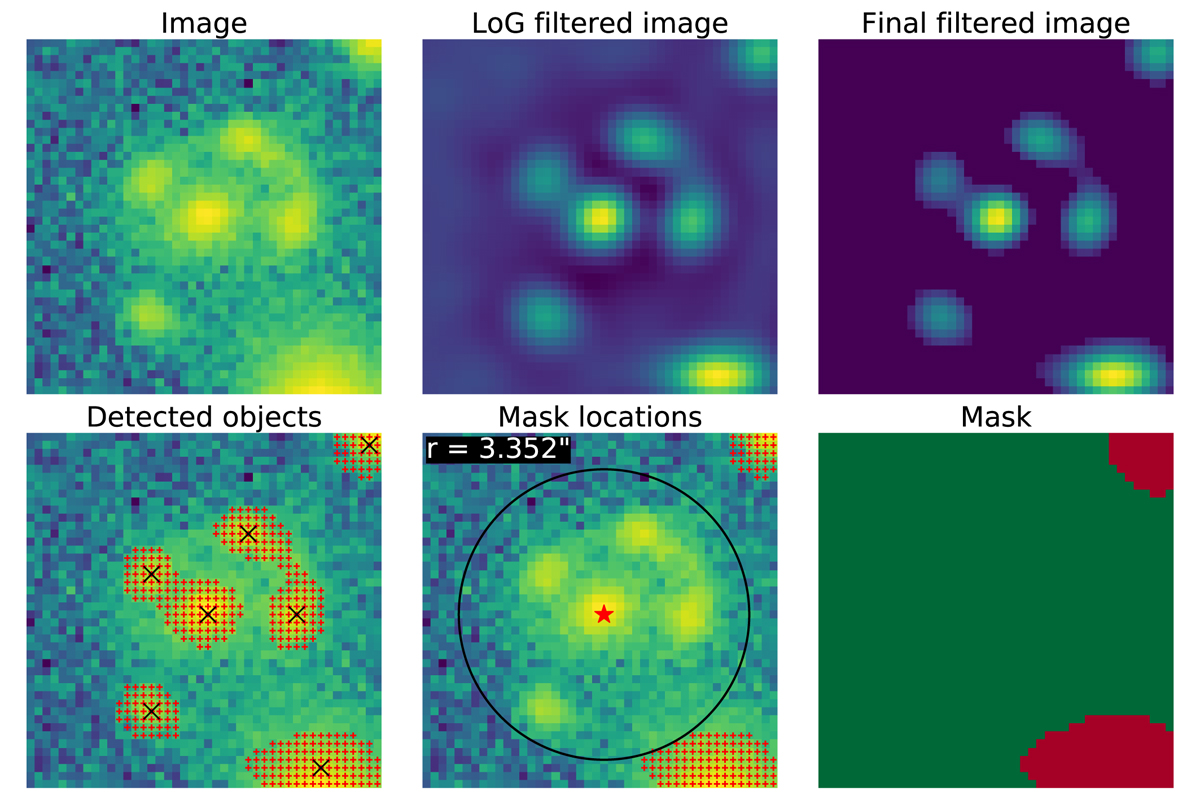
Fig. 8.
Download original image
Illustration of our masking procedure. Upper row: original CFIS image in the r band, followed by the image after applying the LoG filter in the top middle panel. This image is then thresholded and all pixels below 6σsky are set to zero, as shown in the top right panel. Bottom row: detected peaks, whose centroids are marked with black crosses. Bottom middle panel: estimated lens size as a black circle and the red areas indicate what we consider as contaminants. These are masked as the red area on the bottom right image.
Current usage metrics show cumulative count of Article Views (full-text article views including HTML views, PDF and ePub downloads, according to the available data) and Abstracts Views on Vision4Press platform.
Data correspond to usage on the plateform after 2015. The current usage metrics is available 48-96 hours after online publication and is updated daily on week days.
Initial download of the metrics may take a while.