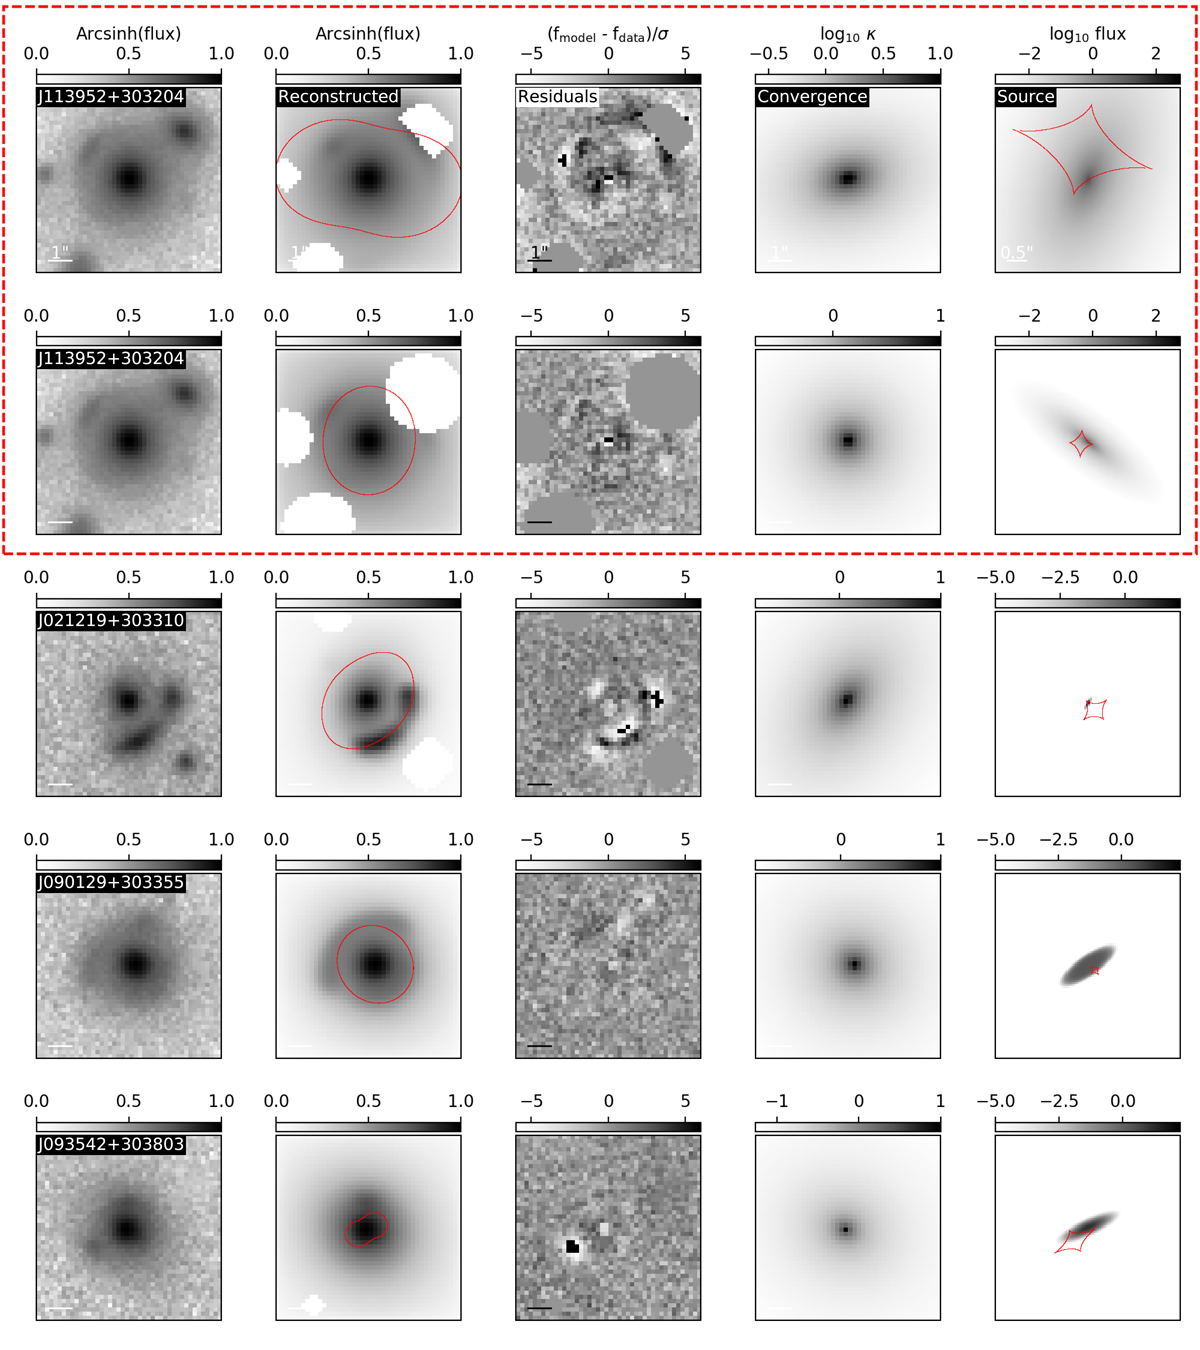
Fig. D.1.
Download original image
Modeling results for the first four of the 32 SL lens candidates. Shown inside the red dashed box are two modeling results for the same image, but with different masks. The top row corresponds to the results from the automated masking procedure, and in the bottom row to the results after applying a custom mask. 1st column: CFIS r-band image. 2nd column: Image reconstruction using best-fit model parameters. The white regions are masked pixels corresponding to locations of neighboring objects in the observed image. In red we show the critical lines of the lens model. 3rd column: Normalized residual map of the image reconstruction. 4th column: Lens mass model convergence map. 5th column: Reconstructed source light profile (unlensed). In red are shown the caustic lines of the lens model.
Current usage metrics show cumulative count of Article Views (full-text article views including HTML views, PDF and ePub downloads, according to the available data) and Abstracts Views on Vision4Press platform.
Data correspond to usage on the plateform after 2015. The current usage metrics is available 48-96 hours after online publication and is updated daily on week days.
Initial download of the metrics may take a while.