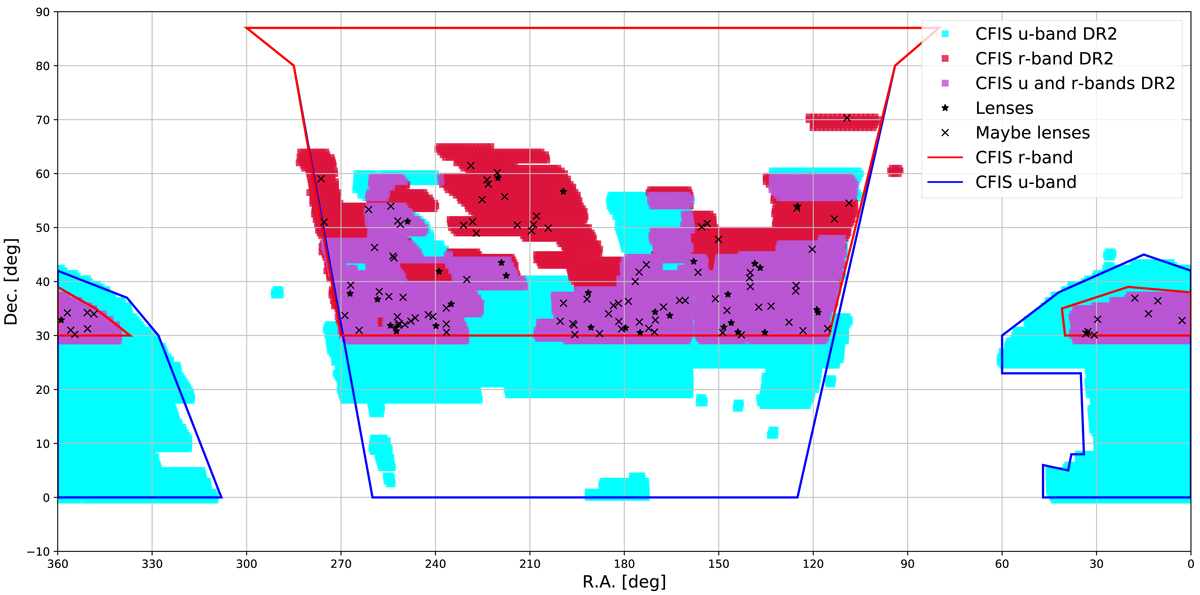
Fig. 1.
Download original image
Illustration of the planned and current CFIS footprint. The contours of the final CFIS-r footprint and the CFIS-u footprint are shown in red and blue, respectively. Shown are the current areas covered in the r band for DR2 (in red), in the u band (in blue), and where r-band and u-band data are available simultaneously (in violet). In this work the u band is used, when available, for visual inspection purpose only. Also indicated is the position of the 32 highest quality candidates (stars) and the 101 maybe lenses (crosses) obtained after the joint visual inspection of the CNN-committee candidates. Of these candidates 104 are new.
Current usage metrics show cumulative count of Article Views (full-text article views including HTML views, PDF and ePub downloads, according to the available data) and Abstracts Views on Vision4Press platform.
Data correspond to usage on the plateform after 2015. The current usage metrics is available 48-96 hours after online publication and is updated daily on week days.
Initial download of the metrics may take a while.