Fig. A.3.

Download original image
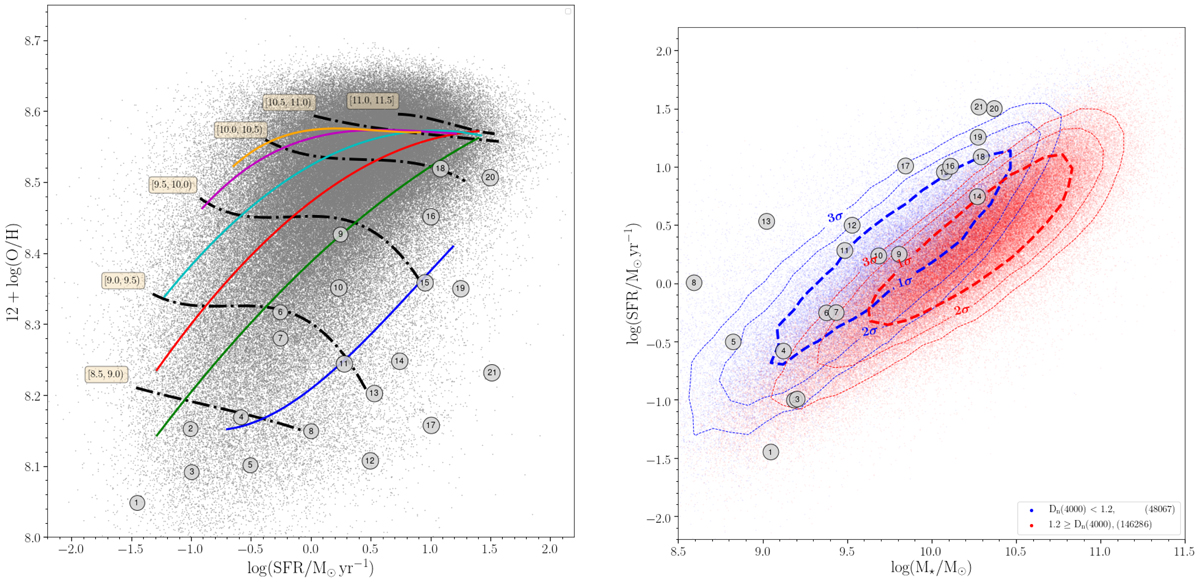
Selection of 21 galaxies from the 12+log(O/H) versus SFR diagram. Left panel: Relation between 12+log(O/H) and SFR for star-forming galaxies. All the lines have the same colours as in Fig. 2. A sample of 21 galaxies has been selected (as an example) in this diagram; their positions are shown with grey circles and have been labelled from 1 to 21 according to their SFR. Right panel: Relation between SFR and M⋆ for star-forming galaxies. The points are colour-coded according to their Dn(4000): blue if Dn(4000) < 1.2, and red if Dn(4000) ≥ 1.2. The dashed lines represent the 1σ, 2σ, and 3σ contours in each Dn(4000) subsample. Grey circles show the positions in the SFR–M⋆ diagram of the 21 galaxies.
Current usage metrics show cumulative count of Article Views (full-text article views including HTML views, PDF and ePub downloads, according to the available data) and Abstracts Views on Vision4Press platform.
Data correspond to usage on the plateform after 2015. The current usage metrics is available 48-96 hours after online publication and is updated daily on week days.
Initial download of the metrics may take a while.


