Fig. 1.

Download original image
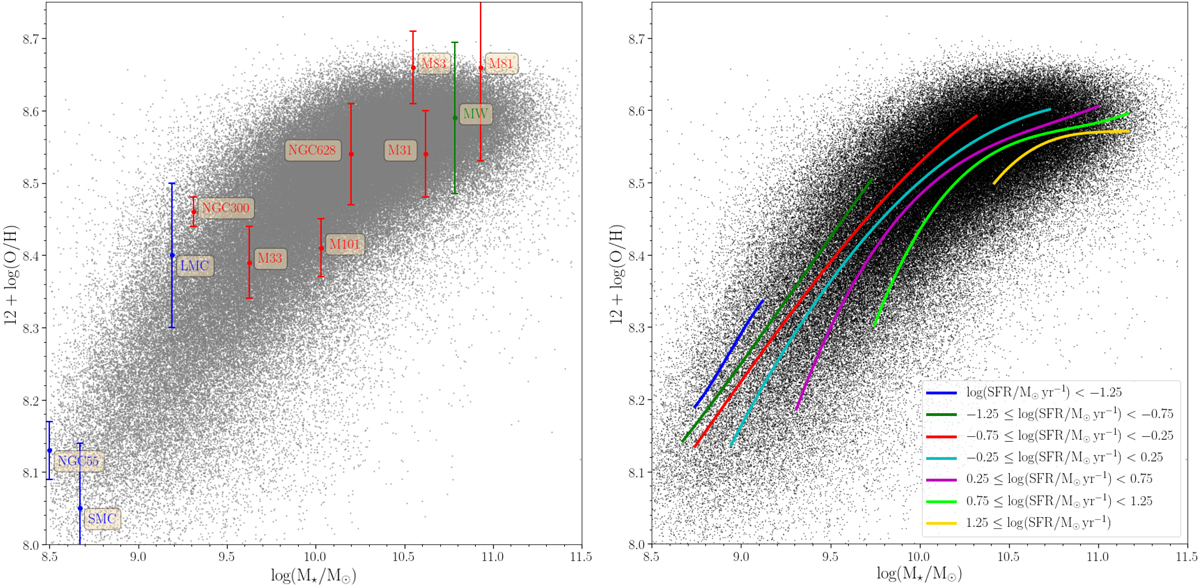
Relation between 12+log(O/H) and M⋆. Left panel: aperture corrected MZR for star-forming galaxies of our sample (grey dots), as well as the Milky Way (green mark) and other nearby galaxies (labelled; coloured points) with direct (from electron temperature) oxygen abundances are shown. Blue or red colour indicate galaxies with a flat or non-zero radial oxygen gradient, respectively. References as follows: galaxy name, O/H reference, stellar mass reference; SMC, LMC, and M81, Bresolin et al. (2016), Kudritzki et al. (2012); NGC 55, Magrini et al. (2017), Lee et al. (2006); MW, Fernández-Martín et al. (2017), Arellano-Córdova et al. (2021), Licquia & Newman (2015); M83, Bresolin et al. (2016), Hernandez et al. (2019), Kang et al. (2016); M33 and NGC 300, Bresolin et al. (2016), Kang et al. (2016); M 31, Zurita & Bresolin (2012), Fisher & Drory (2011); M 101, Croxall et al. (2016), Skibba et al. (2011); NGC 628, Berg et al. (2015), Cook et al. (2014; see also Vílchez et al. 2019). Right panel: aperture corrected MZR for star-forming galaxies, black points. Blue, green, red, cyan, magenta, lime, and yellow solid lines represent the fits to the running median of the SFR of the galaxies, calculated in bins of 1000 galaxy points, corresponding to seven SFR intervals as indicated.
Current usage metrics show cumulative count of Article Views (full-text article views including HTML views, PDF and ePub downloads, according to the available data) and Abstracts Views on Vision4Press platform.
Data correspond to usage on the plateform after 2015. The current usage metrics is available 48-96 hours after online publication and is updated daily on week days.
Initial download of the metrics may take a while.


