| Issue |
A&A
Volume 665, September 2022
|
|
|---|---|---|
| Article Number | A67 | |
| Number of page(s) | 13 | |
| Section | Planets and planetary systems | |
| DOI | https://doi.org/10.1051/0004-6361/202244246 | |
| Published online | 13 September 2022 | |
Search for Jovian decametric emission induced by Europa on the extensive Nançay Decameter Array catalog
1
Instituto Nacional de Pesquisas Espaciais (INPE),
São José dos Campos, Brazil
e-mail: This email address is being protected from spambots. You need JavaScript enabled to view it.
; This email address is being protected from spambots. You need JavaScript enabled to view it.
2
Departamento de Geofísica, Universidade Federal do Rio Grande do Norte (UFRN),
Natal, Brazil
3
LESIA, Observatoire de Paris, Université PSL, CNRS, Sorbonne Université, Université de Paris,
Meudon, France
4
Station de Radioastronomie de Nançay, Observatoire de Paris, Université PSL, CNRS, Université d’Orléans,
Nançay, France
5
LAM, Pythéas, Aix Marseille Université, CNRS, CNES,
Marseille, France
6
School of Cosmic Physics, DIAS Dunsink Observatory, Dublin Institute for Advanced Studies,
Dublin 15, Ireland
Received:
10
June
2022
Accepted:
11
July
2022
Abstract
Context. The electrodynamic interaction between the Galilean satellites and the Jovian magnetosphere generates Alfvén wings that connect the satellites to the polar atmosphere of Jupiter and induce auroral radiation through the cyclotron-maser instability. The satellite control of the Jovian decametric emission is widely known and has been studied since the 1960s, being first discovered with regard to Io and, more recently, Ganymede. The partial control of these emission by Europa and Callisto, however, has not yet been confirmed, however, hints of this control have already been found.
Aims. The goal of this work is to search for evidence of control of the Jovian decametric emission by the satellite Europa.
Methods. For this purpose, we analyzed the extensive digital catalog of Jovian decametric emission detected by the Nançay Decameter Array from 1990 to 2020. We analyzed distributions of the occurrence probability of the emission not induced by Io nor by Ganymede as a function of Europa phase and of the Array’s longitude with regard to the Jovian central meridian of longitude.
Results. As a result, we selected 267 possible Europa-induced emission, from which 186 are from source A (Eu-A), 56 are from source C (Eu-C), and 25 are from source D (Eu-D). The general maximum frequency and duration of these emission are presented and compared to those of the other emission in the catalog and their average power is estimated as a function of the average power of the Io-induced emission.
Conclusions. We conclude that Europa, just as in the case of Io and Ganymede, induces a portion of the Jovian decametric emission.
Key words: radio continuum: planetary systems / radiation mechanisms: non-thermal / methods: statistical / catalogs / planets and satellites: individual: Jupiter, Europa
© H. R. P. Jácome et al. 2022
 Open Access article, published by EDP Sciences, under the terms of the Creative Commons Attribution License (https://creativecommons.org/licenses/by/4.0), which permits unrestricted use, distribution, and reproduction in any medium, provided the original work is properly cited.
This article is published in open access under the Subscribe-to-Open model. This email address is being protected from spambots. You need JavaScript enabled to view it. to support open access publication.
1 Introduction
Jovian decametric (DAM) radio emission are the only known type of planetary radio emission possibly observed by both space-based instruments and ground-based observatories due to the powerful magnetic field of Jupiter, which enables the generation of emission with maximum frequency up to 40 MHz, via the cyclotron-maser instability (CMI; Zarka 1998). This fact enabled the discovery of Jupiter as a radio source (Burke & Franklin 1955) even before the start of spacecraft launches for in situ exploration. Further, it led to the inference of the Jovian strong magnetic field and large magnetosphere, and to the development of early studies regarding the nature of the emission and the origin mechanism. Soon after the discovery of Jupiter’s radio emission, the partial dependence between the emission occurrence and the orbital phase of the satellite Io was identified (Bigg 1964) and enforced the idea of an electromagnetic connection between Io and Jupiter that would grant the control of part of the emission by the satellite (Piddington & Drake 1968; Goldreich & Lynden-Bell 1969; Goertz 1980; Neubauer 1980).
Given that the Galilean satellites other than Io (e.g., Europa, Ganymede, and Callisto) present some properties in common with Io, such as their entire orbits being situated within the Jovian inner-mid magnetosphere and their role as plasma sources – albeit fainter than Io; however given active via surface sputtering and, in the case of Europa, also through water vapor plumes (Roth et al. 2014), it is natural to expect that they also control part of the Jovian DAM emission. In addition, three of the four Galilean satellites are in a Laplace resonance (1:2:4): Io, Europa, and Ganymede. In this context, multiple studies were performed in order to check the existence of evidence for this control. From analyses of ground-based observations, Bigg (1964) did not exclude the possibility of control by Europa, Ganymede, and Callisto. In addition, Lebo et al. (1965) found evidence for control by Europa and Ganymede. However, Dulk (1967) and Wilson et al. (1968), in turn, did not find evidence of control in their studies.
Based on close-range observations from instruments aboard spacecraft such as Voyager 1 and 2, Galileo, Ulysses, and Cassini, more studies have been performed with more statistical significance ensured by the large amount of detected emission due to the continuity of the space-based observation. Menietti et al. (1998, 2001); Higgins et al. (2006); Higgins (2007); Louis et al. (2017) found evidence that all the four Galilean satellites might partly control the Jovian DAM emission.
Furthermore, more recently, the extensive catalog of the Nançay Decameter Array (NDA; Marques et al. 2017) also provided evidence of control by Io, Europa, and Ganymede (Zarka et al. 2018, 2017) thanks to its large amount of emission detected throughout the long-term daily monitoring of Jupiter by the Array in recent decades (from 1990), between 10 and 40 MHz. The catalog also based the in-depth study of the various Jovian DAM components, of Marques et al. (2017).
Therefore, nowadays it is valid to affirm that the control of the Jovian DAM emission by Io, Europa, and Ganymede is substantially verified, but much is yet to be done in order to identify (with high statistical significance) the Europa phases associated with the Europa-induced emission occurrence, to select these emission, and to analyze their properties and their sources at Jupiter.
This work is aimed at identifying more statistically significant evidence on the control of the Jovian DAM emission by Europa, thanks to the extent of the new version of the digital NDA catalog, and at providing the Europa’s phase ranges of occurrence of the probable Europa-induced emission and the general maximum frequency and duration of these emission, as an extension of the work of Zarka et al. (2018). In order to accomplish this aim, we performed analyses of occurrence probability of Jovian emission in the NDA catalog as a function of Europa’s orbital phase, removing the Io- or Ganymede-induced emission. Also, we compared our phase selection with the results of Louis et al. (2017), and estimated the average power of the Europa-induced emission as a function of the Ga-induced emission and the average power of the Io-induced emission.
2 Instrumentation and data
The NDA is a phased array located in the Station of Radioas-tronomy of Nançay, France, built in the 1970s for the study of decametric radio emission from the Sun and Jupiter, becoming operational in late 1977. These two targets are observed by the NDA daily for up to 8 h, approximately 4 h around their meridian transit. The NDA consists of 144 helicoidal antennas sensitive to the frequency range of 10 MHz–120 MHz, making it possible to carry out a measurement of the greater part of Jovian DAM emission. The antennas are distributed over an area of 8000 m2, which assures the high sensitivity of the array, in two subarrays of 72 antennas each, with opposite senses of circular polarization, which enables us to distinguish the dominant polarization of the emission (Boischot et al. 1980; Lecacheux 2000; Lamy et al. 2017). This array was built to be contemporary to the Voyagers Planetary Mission in order to concomitantly study Jupiter with the spacecraft.
The NDA is simultaneously connected to more than one receiver in order to obtain observations in different time and spectral resolutions. The receivers are spectral analysers that have been digital since 1990, namely: the Routine, the New Routine, the Mefisto, and the JunoN. Routine is the oldest receiver still connected, since 1990, and measures the flux density of the emission with dominant circular or elliptical polarization in the left-hand (LH) sense or the right-hand (RH) sense at time-frequency resolutions of 500 ms × 75 kHz for Jupiter, and 500 ms × 175 kHz for the Sun (Lamy et al. 2017).
The extensive NDA catalog of Jovian DAM emission (currently, ~31-yr long, from 1990 to 2020) comprises the daily observations of Jupiter through the Routine receiver. The emission is visually detected on the dynamic spectra and is collected by manual selection through polygonal demarcation. The catalog presents the emission with the corresponding ephemeris data, namely: the longitude of the Earth-Jupiter line, the phase, and the longitude of the Galilean satellites and of Amalthea, as well as the Sun’s and the Earth’s jovicentric latitudes (Marques et al. 2017), and the measured emission characteristics, such as the start and ending times of their visualization by the NDA, their duration, dominant polarization, intensity, and frequency. Each emission in the catalog is associated with one value of intensity, which corresponds to the average, calculated after removing the background intensity; and with several values of frequency, which correspond to the maximum and minimum frequencies of the emission through time. In a ~8 h-long observation, we have none, one, or more than one emission that may be detected. The catalog was first assembled by Marques et al. (2017) and has been constantly updated since then.
3 Search for possible Europa-induced emission in the NDA catalog
In this work, the search for the possible control of part of the Jovian DAM emission by the satellite Europa is performed through the analysis of occurrence probability of the emission on the NDA’s digital catalog, as an extension of the work of (Zarka et al. 2017, 2018). The control of the emission by a Jovian satellite is indicated by non-uniform distributions of occurrence of the emission along the satellite’s orbital phase angle (Φsat) and along the observer’s longitude relative to the Jovian Central Meridian Longitude (CML). The Φsat is counted counterclockwise from opposition to the observer (for more on the angles definition, see Fig. 1 of Marques et al. 2017).
Due to the beaming geometry of the Jovian DAM emission, via the CMI beaming hollow cones along the Jovian magnetic field lines (Wu & Lee 1979; Dulk 1985), the emission become visible to an observer located at the Earth only when the beaming cone’s axis points to the dawn or dusk limbs of Jupiter with regard to the Earth’s location, configuring the classic definition of DAM sources: A, B, C, and D (see Fig. 2 of Marques et al. 2017). The sources A and C are located in the dusk limb of Jupiter, at the northern hemisphere and at the southern hemisphere, respectively; while the sources B and D are located in the dawn limb, at the northern hemisphere and at the southern hemisphere, respectively. Moreover, the satellite control of the emission is set through field-aligned electric currents flowing between the satellite and the source region (Kivelson et al. 2004). Therefore, this control is indicated not by any non-uniform distribution of occurrence probability of the emission along the satellite phase, but by high-probability regions (or peaks) at specific phases, when the satellite is near the sources. Close to the dusk limb of Jupiter (sources A and C), the satellite’s orbital phase is of ~270°; while that close to the C and D sources, in the dawn limb, the satellite orbital phase is of ~90°, both cases considering no separation between the active field line and the instantaneous satellite field line (null lead angle δ). As a consequence, to indicate partial control of the emission by Europa, we expect to find regions or peaks of high probability of emission occurrence around Europa phases of 90° and 270°.
In our analyses, we excluded the emission induced by Io or Ganymede (hereafter called, respectively, the Io-DAM and Ga-DAM emission) in order to remove the effect of these satellites on the emission occurrence, which could appear as Europa control due to the orbital resonance among Io, Ganymede, and Europa. The selection of the Io-DAM emission and Ga-DAM emission on the NDA’s catalog was based on the works of Marques et al. (2017) and Zarka et al. (2017, 2018), which defined CML × ΦSat intervals of occurrence of these emission through analysis of their occurrence probability. The emission not induced by Io nor by Ganymede are hereafter called the non-Io-Ga emission and are the ones analyzed in this work.
The distribution of occurrence probability of the non-Io-Ga emission in the NDA’s catalog on the CML × ΦSat planes relative to Io and to Ganymede is shown in Fig. 1. The phase of Io was considered in the plots on the left, and the phase of Ganymede, in the plots on the right. The emission were separated by their sources in Jupiter (A, B, C, and D). The data are presented in 5° × 5° bins of the observer’s longitude versus the satellite’s orbital phase. The occurrence probability was calculated for each bin as the number of detected emission from the specific source relative to the total number of observations by the NDA in the bin.
In the CML × ΦSat diagrams of Fig. 1, no phase intervals with enhanced occurrence probability of the emission are observed, which indicates that the emission is indeed not induced by Io nor by Ganymede. Instead, occurrence probability gaps are observed, such as in -220° < ΦIo < ~250° in (a); ~50° < ΦIo < ~110° in (b); ~225° < ΦIo < ~260° in (c); ~30° < ΦGa < ~70° in (f); and ~250° < ΦGa < ~270° in (g). These gaps result from the removal of the Io-DAM and Ga-DAM emission (Zarka et al. 2017, 2018; Marques et al. 2017). The (CML; satellite phase) regions associated with each component of the Io-DAM emission and the Ga-DAM emission are shown in Fig. 1 of Zarka et al. (2018), in which a pattern can be noticed in both CML range and satellite phase range associated with each component of the satellite-induced emission. The satellite-induced emission from Jupiter’s dusk limb (source A or C) occur normally at high values of longitude, from ~180° to ~360° for source A, and from ~260° to ~460° for the source C, both at ΦSat between ~180° and ~260°. On the other hand, the satellite-induced emission from the dawn limb (source B or D) occur in ΦSat < 130°, between the longitudes of ~60° and ~200°, for the source B, and in a wide longitude range for the source D.
The number of events for each component of the Io-DAM, the Ga-DAM, and the non-Io-Ga DAM emission in the current NDA’s catalog, as well as the median, average, standard deviation, and maximum values of their maximum frequency and duration, are shown in Table 1. As observed by Marques et al. (2017), the Io-DAM emission have in general higher maximum frequencies than those of the non-Io emission, mainly for the components A and B. On the other hand, the Ga-DAM emission have, in general, maximum frequency similar to the ones of the non-Io-Ga emission. With regard to the emission duration, all components of the Io-DAM emission seem to be longer than the Ga-DAM and non-Io-Ga emission, which, in turn, have about the same duration within the statistical uncertainty. The Ga-DAM emission from the source A (Ga-A) are in average 6 min shorter than the non-Io-Ga A emission, and the Ga-C emission, > 10 min longer than the non-Io-Ga C emission.
Moreover, the occurrence probability of the non-Io-Ga emission in the CML × ΦSat was calculated with regard to Europa’s Article number, page 4 of 13 orbital phase to search for indications of control of the emission by Europa. The plots are shown in Fig. 2. The emission were also separated by their sources at Jupiter, and their occurrence probability was determined for every 5° × 5° bin, as described before. Additionally, for each component of the non-Io-Ga DAM emission, we also obtained the distribution of occurrence probability integrated over the entire CML interval (plots in the center of Fig. 2) and over the CML range with highest probability (on the right). This configuration is applied for better evaluating the peaks’ amplitude along the satellite phase, with the occurrence probability presented as a function of the standard deviation (σ) of the set. The CML ranges of integration are indicated on top of the plots and by the dashed lines in the (CML, phase) diagrams. From these plots in Fig. 2, we selected high-probability regions (CML × ΦEu) that may be associated with Europa-induced (Eu-DAM) emission occurrence. The intervals of Europa phase associated with these regions are colored in the plots.
In both the data sets relative to the source A (Fig. 2, plots a and b) and to the source C (plots g and h), distributed and integrated over the entire CML range, two high-probability regions were observed, revealing a quasi-harmonic behavior of the emission occurrence probability when it is plotted as a function of Europa phase. For source A, the highest peaks are observed around ΦEu = 50° and ΦEu = 250°. For source C, the highest peaks are observed around ΦEu = 30° and ΦEu = 250°. This quasi-harmonic behavior is not expected, since sources A and C are both located at the dusk limb of Jupiter; close to this location, the satellite is at an orbital phase of approximately 270° (for a null lead angle, δ = 0°). Therefore, although the high-probability peaks observed within 0° < ΦEu < 60° in plots b and h seem to indicate control of the emission by Europa, they are not related to the occurrence of Eu-DAM emission, since Europa is close to the opposite limb of Jupiter, while the emission are beamed from the source A or C. On the contrary, we found that this quasi-harmonic distribution results from the removal of the Io-induced emission from the sources A and C combined with the Laplace resonance between the satellites, as shown in the analysis presented in the Appendix A.
Furthermore, when we integrate the probabilities over the CML ranges of 200°–290° for the source A (plot c) and of 280°–20° for the source C (plot i), which are the respective CML ranges with the highest occurrence probability, that quasi-harmonic behavior fades, resulting in a single high probability peak in each set, especially in the data relative to the source C. In the plots c and i of Fig. 2, these peaks are observed both around ΦEu = 245°. They are most probably associated with the occurrence of the emission induced by Europa in the sources A and C, and thus are referred to as Eu-A and Eu-C, respectively.
Relative to source B (Fig. 2, plots d, e, and f), no relevant high-probability peak was observed, which does not exclude possible Europa control of the emission from the source B; however, this does indicate that if Europa indeed controls part of these emission, there are still not enough samples of the Europa-induced emission to stand out among the non-Io-Ga B emission.
Finally, for source D, one thin high-probability peak was observed when the emission occurrence probability was integrated over the entire CML range (Fig. 2, plot k), around the Europa phase of ~210°. However, when the probability is integrated over the CML range of 165°–290°, in which the occurrence probability is the highest, a well distinguished peak of probability shows up alone between 120° ≤ ΦEu < 150°, as shown in plot l, when Europa is nearer to the Jovian dawn limb. This peak may be associated with the occurrence of emission from the source D induced by Europa and, thus, indicates partial control of this component by Europa. We, thus, name this peak Eu-D, as well as the phase and CML ranges associated with it.
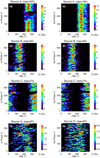 |
Fig. 1 Occurrence probability of the emission not induced by Io nor by Ganymede as a function of the orbital phases of Io and Ganymede, and the Jovian longitude (CML) of the Earth-Jupiter line. The emission was detected by the NDA from 1990 to 2020. The probability was calculated in 5° × 5° bins (CML × phase) for each component of the Jovian emission (A, B, C, and D). |
Statistical parameters of maximum frequency and duration distributions of the Io-DAM emission and the Ganymede-DAM emission, and of the non-Io-Ga DAM emission.
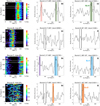 |
Fig. 2 Occurrence probability of the emission not induced by Io nor by Ganymede, separated by their sources, distributed as a function of the CML and Europa’s orbital phase (left). Distribution of the occurrence probability integrated over the entire CML range (0°–360°) (center). Distribution of the occurrence probability integrated over the CML range in which enhanced occurrence is observed (right). The horizontal white lines (in the plots on the left) and the vertical black lines (in the other plots) delimit the phase intervals associated with the Eu-DAM emission detected by Louis et al. (2017). The dashed lines delimit the CML ranges of probability integration shown in the plots on the right. |
4 Comparison with Europa-induced DAM emission in the catalogs of Cassini and the Voyagers
In order to test our emission selection, we also considered the results published by Louis et al. (2017), with regard to the Eu-DAM emission on the Jovian DAM emission catalogs of Voyager 1 and 2, and Cassini spacecraft. Those authors used the Exo-planetary and Planetary Radio Emissions Simulator (ExPRES) (Louis et al. 2019) to simulate Eu-DAM emission as seen by those spacecraft and then compared the simulations with the real data, classifying the matching emission as probable Eu-DAM. The sources of the emission could also be inferred.
Louis et al. (2017) analyzed emission detected by the Voyager-1 and Voyager-2 and Cassini during their flybys of Jupiter in 1979 and 2000-2003, respectively. The radio experiments on both Voyager spacecraft are sensitive to the frequency range of 1.2 kHz–40.5 MHz (Warwick et al. 1977), covering the entire Jovian DAM emission frequency range. The antennas of Cassini, on the other hand, were sensitive to the frequency range of 3.5 kHz – 16 MHz (Gurnett et al. 2004), covering only part of the Jovian DAM emission. Europa phase intervals relative to the Eu-DAM emission detected in their analysis were 80° < ΦEu < 115° (for the emission from the sources B and D), and 245° < ΦEu < 280° (for the emission from the sources A and C). These intervals are delimited in Fig. 2 by the horizontal white lines and the vertical black lines. In addition, Lamy (2016) analyzed the average flux density of Cassini’s observations in its flybys of Jupiter and found a hint of Eu-D emission occurring in a phase interval coinciding with the one observed by Louis et al. (2017).
However, even though those results might contribute to endorsing part of our analysis, it is necessary to mention the differences between the data collected by the different instruments. The proximity of the Voyager and Cassini spacecraft to the sources during the flybys enables the detection of weak emission, while the NDA can detect only strong emission due to its large distance from the sources. Therefore, the spacecraft can also detect emission that is not observed in the NDA’s catalog. Additionally, the frequency range observed by Cassini, whose catalog was the most extensive one analyzed in the study of Louis et al. (2017), corresponds only to the lower part of the frequency range of the Jovian DAM emission, while the NDA’s observation frequency range corresponds to most of the Jovian DAM frequency range, from ~ 10 MHz. Those divergences certainly affect the observed emission and, thus, the phase and CML intervals associated with the probable Eu-DAM emission.
Therefore, in the comparison with the results of Louis et al. (2017), either matching or near-matching between our selection of phase intervals and their phase selection may reinforce our selection. This comparison supports the selection of the phase intervals associated with the probability peaks Eu-A, Eu-C, and (less strongly) Eu-D, but in different CML ranges (see Fig. 6 of Louis et al. 2017). Although the ΦEu range relative to our Eu-D emission does not coincide with that found by Louis et al. (2017), we note that the Eu-D peak is preeminent in the data set and the phase lag observed is minimal. In addition, we also note that the number of samples of non-Io-Ga DAM emission from the source D is the smallest (with max. occurrence probability of 5%) among all the components of the non-Io-Ga DAM emission. Then, we expect that, as the catalog is updated and more samples of non-Io-Ga D emission are detected, the Eu-D peak will become more well distinguished if it is indeed related to the occurrence of Eu-D emission, perhaps even lessening the phase lag. For now, we maintain the selection of the Eu-D emission, but as only possible Eu-D.
5 General characteristics of the Europa-induced DAM emission
Based on the preceding analyses, we selected all the emission occurring within the (CML, phase) regions Eu-A, Eu-C, and Eu-D, classifying them as induced (Eu-A and Eu-C) or possibly induced (Eu-D) by the satellite Europa. The Eu-A emission features those with start and end within CML = 200°−290° and ΦEu = 230°−260°; the Eu-C emission, within CML = 280°−380° (20°) and ΦEu = 240°−268°; and the possible Eu-D emission, within CML= 165°−290° and ΦEu = 120°−145°. We identified from the NDA’s digital extensive catalog, 186 Eu-A emission, 56 Eu-C emission, and 25 possible Eu-D emission. The (CML, ΦEu) regions of occurrence of these emission are shown in Fig. 3, in the (CML, ΦEu) diagrams of the occurrence probability distribution of all the non-Io-Ga DAM emission and of the Eu-DAM emission alone (plots a and b, respectively). These diagrams may be compared with the ones of Fig. 1 of Zarka et al. (2018). We note that the pattern in the CML and satellite phase ranges for each component that was observed for the Io-DAM and the Ga-DAM emission is repeated for the Eu-DAM emission, mainly for the Eu-A and Eu-C components, which strengthens these emission selection. The CML and satellite phase ranges of the possible Eu-D emission coincide partially with those of the Io-D emission.
The distributions of maximum frequency and duration of Europa-induced emission are shown in Fig. 4 and the statistical parameters (median, average, and standard deviation) of these distributions are shown in Table 2. The maximum frequency of the Eu-A emission (average of 24.9 MHz), originating in the northern hemisphere of Jupiter, is on average higher than the maximum frequency of the Eu-C (avg. of 19.2 MHz) and Eu-D (avg. of 20.8 MHz) emission, both originating in the southern hemisphere of Jupiter. Higher values of maximum frequency of the Jovian northern emission in comparison with those of the southern emission are expected as a consequence of the high intensity of the magnetic field in the northern hemisphere due to the presence of the anomaly of high-amplitude magnetic field (Connerney et al. 2018).
With respect to the duration of the emission, it is an aspect that is difficult to evaluate based on the NDA’s catalog because the apparent duration of the emission is affected by diverse factors, such as the rotation of Jupiter and of the Earth, the change in declination of the Earth with regard to Jupiter (Boudjada & Leblanc 1992; Leblanc et al. 1993), and the distance variation between the planets (Zarka et al. 2018). These factors contribute to an accumulation of short emission. Even so, from the values of average duration on Table 2, the Eu-D type appears to be the one with the longest emission, with average of 42.0 min, followed by the Eu-C emission and the Eu-A emission, with average of 40.5 min and 33.9, respectively. We highlight, however, that since the southern emission has a maximum frequency that is lower than the northern emission, the emission from sources C or D are not as well visually distinguished in the dynamic spectra as the emission from sources A or B, due to radio interference in low frequencies and the terrestrial ionosphere cut-off. This may lead to the detection of only small portions of the southern emission. Therefore, the Eu-D and Eu-C emission may be even more extended in time.
In comparison to the values on Table 1 relative to the Io-DAM and Ga-DAM and the Non-Io-Ga emission, the Eu-DAM emission have maximum frequency values similar to those of the Ga-DAM and the Non-Io-Ga DAM emission, and smaller than those of the Io-DAM emission, mainly in the components from the Jovian northern hemisphere. With regard to the duration, the Eu-DAM emission are on average similar in duration to the Ga-DAM emission and to the Non-Io-Ga DAM emission, both shorter than the Io-DAM emission.
Statistical parameters of the maximum frequency and duration distributions of the Europa-induced emission.
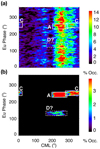 |
Fig. 3 Occurrence probability of all emission not induced by Io nor by Ganymede in the NDA current catalog as a function of Europa phase and of the Jovian CML (a) and the occurrence probability of possible Europa-induced emission as a function of Europa phase and of the CML (b). The (CML, phase) regions associated with the Eu-DAM components are indicated by the white boxes. |
6 Energetics of the Io-DAM, Ga-DAM, non-Io DAM, and Eu-DAM emission
In this section, we present an analysis of the emission energetics. This analysis is based on the one presented by Zarka et al. (2018), who compared the energy of the Ga-DAM emission in the 1990–2015 version of the NDA catalog with that of the Io-DAM emission, based on the emission distributions of intensity and of duration. In the analysis, both duration and intensity were normalized for a distance of 5.2 AU, which is the average Earth-Jupiter distance (R), since both these parameters are, as detected by the array, dependent on the distance from the emission’s source. The emission intensities were normalized with the multiplication by (R/5.22), while the duration was normalized via Eq. (2) Zarka et al. (2018).
Upon the normalization of the emission intensity, we obtain the distributions shown in Fig. 5. As observed by Zarka et al. (2018) and Marques et al. (2017) for the non-Io emission, the distribution of intensity of the emission not induced by either Io, Ganymede, or Europa (non-Io-Ga-Eu) is very similar to the one of the emission induced by Io. Also, as noted by Zarka et al. (2018), the Ga-DAM emission has intensities in a slightly lower range than the one of the Io-DAM and of the non-Io-Ga-Eu DAM (in about 0.5 dB). This same shift of −0.5 dB is observed in the Eu-DAM emission distribution. Moreover, both the Eu-DAM and the Ga-DAM are significantly less frequent in the catalog than the Io-DAM and the Non-Io-Ga-Eu DAM emission, as already shown in Tables 1 and 2. Then, in order to estimate the differences between these distributions of intensity, we shifted the distributions of the Eu-DAM and the Ga-DAM emission by adding 0.5 dB to the emission cataloged intensities, following the procedure of Zarka et al. (2018). Thus, we divided the shifted distributions bin to bin by the Io-DAM distribution, and obtained an average value of ~1/11.8, indicating that the shifted Ga-DAM distribution is approximately 11.8 times shorter than the Io-DAM distribution, in number of emission. The same was applied for the Eu-DAM distribution and an average value of ~1/11.7 was obtained from the bin-to-bin division with the Io-DAM distribution. Figure 5 shows the intensity distributions of the Io-DAM, non-Io-Ga-Eu DAM, Ga-DAM and the Eu-DAM emission.
The distribution of intensity of the Eu-DAM emission was also compared with the Ga-DAM distribution. Since they have the same intensity range, the distributions were simply divided bin to bin, and an average value of ~1/1.71 was obtained, indicating that the Eu-DAM emission are only 1.71 times less frequent than the Ga-DAM emission. This comparison is shown in plot b of Fig. 5.
On the other hand, if we simply divide the total number of emission Io-DAM, Ga-DAM, and Eu-DAM in the current NDA catalog, we obtain the following ratios: ~1/9.38 for Ga/Io, ~1/14.8 for Eu/Io, and ~1/1.58 for Eu/Ga.
Furthermore, in order to compare the distributions for the emission duration (corrected by distance), we normalized the distributions by dividing each bin by the highest value of each distribution, to obtain histograms with maximum value of 1. Thus, we multiplied each Ga-DAM and Eu-DAM event’s duration by a factor of correction a, which varied from 0.5 to 3.0 by steps of 0.05, before creating new distributions. New histograms for the Ga-DAM and Eu-DAM emission were created for each value of a, and, in each case, the new distribution was divided bin to bin by the Io-DAM distribution and by the non-Io-Ga-Eu DAM distribution. In Fig. 6, the distributions of duration of the Eu-DAM and Ga-DAM emission multiplied by a, which is indicated on top of each plot, are shown in black; the bin-to-bin divisions are shown by the red, blue, and thin green lines, which were limited to the duration range of 15–105 min, for the plots on the left; and of 15–65 min, for the plots on the right. These intervals correspond to the time range between the peak of the non-rescaled histograms (α = 1.00) and the end of histograms with the shortest values of duration (α = 0.50). The thick lines, in the same colors, are lin-log fits, whose slopes are also indicated on top of each plot. When the slope is closest to zero, the histogram with the duration multiplied by the factor alpha matches the Io-DAM or non-Io-Ga-Eu DAM histograms. Thus, we obtain α = 1.05 (±0.025) for the Ga/non-Io-Ga-Eu ratio; α = 2.40 (±0.025) for the Ga/Io ratio; α = 0.80 (±0.025) for the Eu/Ga and the Eu/non-Io-Ga-Eu ratios; and α = 2.85 (±0.025) for the Eu/Io ratio. It is important to highlight that this analysis for the Eu-DAM emission tends to be less precise because of the short duration range contemplated in the bin-to-bin division, which corresponds to less than one-third of the entire time range of the longest rescaled histogram (α = 3.0). Figure 7 sums up the analysis of the emission duration, showing the histograms of the Ga-DAM emission duration multiplied by α = 1.05 and α = 2.40, and the Eu-DAM emission duration multiplied by α = 0.80 and α = 2.85, with the other distributions.
From these analyses, we conclude that the Ga-DAM emission and the Eu-DAM emission are, respectively, ~11.8 times and ~11.7 times less frequent and only 0.5 dB weaker than the Io-DAM emission. Regarding their duration, the Ga-DAM and Eu-DAM emission are ~2.40 times and ~2. 85 times, respectively, shorter in time than the Io-DAM emission. Then, the average power of the Ga-DAM emission is ~30 times (2.4 × 11.8 × 100.025) lower than the average power of the Io-DAM emission, and the average power of the Eu-DAM emission is ~35 times (2.85 × 11.7 × 100.025) lower than the average power of the Io-DAM emission. Moreover, from the comparison between the Eu-DAM and the Ga-DAM emission, we obtain that Eu-DAM emission are only ~1.71 times less frequent and 0.80 shorter than the Ga-DAM emission. Then the average power of the Eu-DAM is ~1.45 times (0.80 × 1.71 × 100.025) lower than the average power of the Ga-DAM emission.
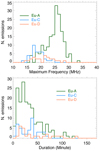 |
Fig. 4 Distributions of maximum frequency and duration of the emission classified as possible Eu-A, Eu-C and Eu-D. |
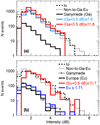 |
Fig. 5 Distributions of intensity (in dB above the Galactic background, and normalized to the average Earth-Jupiter distance of 5.2 AU) of the Ga-DAM emission (a) and the Eu-DAM emission (b) compared to those of the Io-DAM emission and the non-Io-Ga-Eu emission. In (a), the histogram in light blue is the intensity distribution of the Ga-DAM emission multiplied by 7.8 (Zarka et al. 2018) for comparison. |
7 Summary and conclusions
In this paper, we present a survey of Jovian Decametric radio emission detected by the Nançay Decameter Array over the last three decades (1990–2020). This study is focused on the partial control of these emission by the satellite Europa. Based on our analyses, we conclude that the emission occurring within the phase and CML intervals corresponding to the Eu-A and Eu-C regions, determined in this work, are most likely induced by the satellite Europa’s interaction with the Jovian magnetosphere (Kivelson et al. 2004, 2009). The emission occurring within the Eu-D region is also possibly induced by Europa. The UV footprints of Europa near Jupiter main aurora have previously been observed (Clarke et al. 1998, 2002). Since it is known that Europa induces currents in its environment due to its interactions with Jupiter (Kivelson et al. 2000) and, more recently, it was noted that Europa plumes may eject material around its space (Roth et al. 2014), it is suggested that Europa has an interaction with the Jovian magnetic field that is similar to the Io-Jupiter interaction, but on a reduced scale, with a more tenuous plasma torus crossing Jovian magnetic field lines. This interaction results in the propagation of Alfvén waves along the field lines, inducing energetic electron maser cyclotron distributions, which can lead to DAM emission.
From our analysis, we identified 186 Eu-A emission, 56 Eu-C emission, and 25 possible Eu-D emission. Among those emission, the Eu-A type is the one with highest maximum frequency due to the high-amplitude anomaly of magnetic field in the northern hemisphere of Jupiter, and the Eu-D emission are the longest in time. No Europa-induced emission were detected among the analyzed sample of Jovian DAM emission from the source B, but the partial control of these emission by Europa still cannot be ruled out. The lack of evidence of Europa control on the source B is interpreted as lack of samples of Europa-induced emission from the source, which is in agreement with the observations of Louis et al. (2017), who identified very few cases of Eu-B emission (16 cases) compared to the other components (Eu-A: 29, Eu-C: 31, Eu-D: 54 cases). We expect that Eu-B emission will be statistically detected in the future as the NDA catalog is upgraded.
The Eu-DAM emission have maximum frequency similar to that of the Ga-DAM emission, both lower than the maximum frequency average of the Io-DAM emission. Moreover, the distributions of intensity (normalized to an Earth-Jupiter distance of 5.2 AU) of the Eu-DAM emission and of the Ga-DAM emission on the NDA catalog are similar, but shifted −0.5 dB with regard to that of the Io-DAM emission and of the non-Io-Ga-Eu DAM emission. From the comparison between the distributions of duration and intensity of these emission, we find that the Eu-DAM emission and the Ga-DAM emission average power are, respectively, ~35 times and ~30 times lower than the average power of the Io-DAM emission.
Moreover, our analyses also indicate that bimodal distributions of the emission occurrence as a function of a satellite’s orbital phase should not be promptly interpreted as evidence of partial control of the emission by the satellite, since it can result from the removal of emission induced by other satellites. Instead, the control is indicated for the emission separated by their sources via the accumulation of emission (or high occurrence probability) in single narrow bands (~40°) of the satellite phase. In this context, it becomes appropriate to reanalyze the results of previous works that report satellite control of Jovian DAM emission based on the amplitude of least-square fits to the emission occurrence probability as a function of the satellite phase.
In conclusion, we confirm that we found evidence for the Europa-Jupiter interaction influence on part of the Jovian radio DAM emission. It is the first time that Eu-DAM emission have been detected statistically. This study complements the works of Zarka et al. (2017, 2018), who detected evidence of control of the Jovian DAM emission on the NDA catalog by Ganymede and Europa, and who also identified the Ga-DAM emission in the catalog. It also complements the work of Louis et al. (2017), who mainly detected Eu-DAM emission below 16 MHz, whereas here it is detected above ~15 MHz, which provides new constraints on the upper-frequency extension of these emission.
Our results could be used in future works with observations that also cover the low-frequency band of the Jovian radio emission and with modeling studies of the radio emission of Jupiter with tools for emission simulation, such as the ExPRES code.
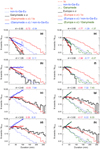 |
Fig. 6 Normalized distributions of duration (corrected to the average Earth-Jupiter distance, of 5.2 AU) of the emission induced by Io, Ganymede, Europa, and the emission not induced by either of these satellites (the non-Io-Ga-Eu emission) in the NDA catalog. The distributions were divided by their maximum value in order to have maximum in 1, and were plotted for the estimation of the ratio (α) between the different emission types’ durations. The distributions of the Ga-DAM emission durations multiplied by α are shown with the distributions of duration of the Io-DAM and of the non-Io-Ga-DAM emission in the plots on the left. The distributions of the Eu-DAM emission durations multiplied by α are shown with the distributions of duration of the Io-DAM, of the Ga-DAM, and of the non-Io-Ga-Eu emission in the plots on the right; the value of α was analyzed from 0.5 to 3.0 with steps of 0.5. The value of α in each case is indicated on top of each plot. The thin blue, red, and green lines are bin-to-bin ratios between the distributions. The thick lines in the same colors are lin-log fits to these ratios, and their slopes are indicated on top on each plot, with the respective colors. For Ganymede, the bin-to-bin ratio was computed over the duration range of 15–105 min, and of 15–65 min for Europa. |
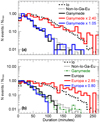 |
Fig. 7 Distributions of duration (in minutes, and corrected to the average Earth-Jupiter distance of 5.2 AU) of the Ga-DAM emission (a) and the Eu-DAM emission (b) compared to those of the Io-DAM emission and the non-Io-Ga-Eu emission. |
Acknowledgements
The authors thank the Brazilian funding agencies CAPES and CNPq for financial support. Part of this work was supported by the São Paulo Research Foundation (FAPESP), grant 2019/03533-6. E. Echer would like to thank Brazilian agencies for research grants: CNPq (PQ-301883/2019-0) and FAPESP (2018/21657-1). C.K. Louis’ work at DIAS is supported by the Science Foundation Ireland Grant 18/FRL/6199. The authors also thank the Brazilian Ministry of Science, Technology and Innovation and the Brazilian Space Agency.
Appendix A Origin of the bimodal distributions of occurrence probability as a function of Europa phase
As discussed in Sect. 3, we present in this appendix an analysis of the data on the current NDA catalog to show that the quasi-harmonic distributions observed for the non-Io-Ga A and non-Io-Ga C emission as a function of Europa phase actually result simply from the removal of the Io-induced emission from the source A or C (the Io-A, Io-A’, Io-A” and Io-C emission).
First, all the daily observations on the NDA’s catalog were counted for 1° × 1° (CML×ΦSat) bins and plotted as a function of Io phase and Europa phase (plots a and b in Fig. A.1). The distributions are quite homogeneous. The same counting was made with all the emission detected by NDA from 1990 to 2020 (both the Io-DAM, the Ga-DAM and the non-Io-Ga emission). The distributions are shown in plots c and d of Fig. A.1.
Then, the occurrence probability of all the emission in the catalog was calculated for each bin, considering the corresponding numbers of observations and of emission detected, and it is shown in plots e and f of Fig. A.1. We note that, in plot f, the occurrence probability over the CML range of 210° and 320° is uniform along the entire Europa phase. This CML range is the one with highest occurrence probability. The probability integrated in this longitude range is presented as a function of Europa phase in plot g (in 1° bins) and in plot h (in 5° bins). The distributions are essentially flat.
Furthermore, we removed the NDA’s observations that have more than 30% of itself occurring in the Io phase range of 180° ≤ ΦIo ≤ 260°, which corresponds to the range of occurrence of the Io-induced emission from the source A or C. Then, the diagrams of Fig. A.1 were repeated with the remaining data and are shown in Fig. A.2. In plots d and f of Fig. A.2, a slight decrease in number of emission and in occurrence probability is observed in some ΦEu bands within 210° ≤CML≤ 320°. Moreover, when we integrate the occurrence probability over this CML range, shown in plots g and h of Fig. A.2, the distribution presents a well visible bimodal feature along Europa phase.
Thereby, we showed that this quasi-harmonic behavior of the probability distribution does not result from the partial control of the emission by Europa, but, instead, from the removal of the large amount of Io-induced emission occurring between the Io phase range of 180° – 260°.
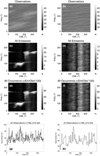 |
Fig. A.1 Distributions of all observations, emission and the occurrence probability of the emission detected by the Nançay Decameter Array from 1990 to 2020. (a) and (b): Number of Jovian observations by the Nançay Decameter Array (NDA) plotted as a function of the Jovian longitude of the observer (CML) and the Io phase (PhIo) (in (a)) or Europa phase (PhEu) (in (b)), in 1° × 1° bins. (c) and (d): Number of emission detected by the NDA in 1° × 1° bins (CML×ΦIo) (in (c)) and (CML×ΦEu) (in (d)). (e) and (f): occurrence probability of all the emission in 1° × 1°. (g) and (h): integration of the emission occurrence probability over the CML range of 210° × 320° as a function of the Europa phase, in 1° bins (in (g)) and in 5° bins (in (h)). This CML range corresponds to the one in plot (f) with most enhanced probability. |
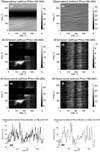 |
Fig. A.2 Distributions of the observations, emission and the occurrence probability of emission after the removal of those occurring within the Io phase range of 180° – 260°, which corresponds to the phase interval of occurrence of the Io-induced emission from the sources in the dusk (A and C). The distribution of the emission occurrence probability integrated over the CML range of 210° – 320°, plotted as a function of Europa phase, becomes bimodal. |
References
- Bigg, E. K. 1964, Nature, 203, 1008 [NASA ADS] [CrossRef] [Google Scholar]
- Boischot, A., Rosolen, C., Aubier, M. G., et al. 1980, Icarus, 43, 399 [Google Scholar]
- Boudjada, M., & Leblanc, Y. 1992, Adv. Space Res., 12, 95 [NASA ADS] [CrossRef] [Google Scholar]
- Burke, B. F., & Franklin, K. L. 1955, J. Geophys. Res., 60, 213 [NASA ADS] [CrossRef] [Google Scholar]
- Clarke, J. T., Ballester, G., Trauger, J., et al. 1998, J. Geophys. Res.: Planets, 103, 20217 [NASA ADS] [CrossRef] [Google Scholar]
- Clarke, J. T., Ajello, J., Ballester, G., et al. 2002, Nature, 415, 997 [NASA ADS] [CrossRef] [Google Scholar]
- Connerney, J. E. P., Kotsiaros, S., Oliversen, R. J., et al. 2018, Geophys. Res. Lett., 45, 2590 [Google Scholar]
- Dulk, G. A. 1967, ApJ, 148, 239 [NASA ADS] [CrossRef] [Google Scholar]
- Dulk, G. A. 1985, ARA&A, 23, 169 [Google Scholar]
- Goertz, C. K. 1980, J. Geophys. Res.: Space Phys., 85, 2949 [NASA ADS] [CrossRef] [Google Scholar]
- Goldreich, P., & Lynden-Bell, D. 1969, ApJ, 156, 59 [Google Scholar]
- Gurnett, D. A., Kurth, W. S., Kirchner, D. L., et al. 2004, Space Sci. Rev., 114, 395 [NASA ADS] [CrossRef] [Google Scholar]
- Higgins, C. A. 2007, J. Geophys. Res.: Space Phys., 112 [Google Scholar]
- Higgins, C., Menietti, J., & Christopher, I. 2006, Geophys. Rese. Lett., 33 [Google Scholar]
- Kivelson, M. G., Khurana, K. K., Russell, C. T., et al. 2000, Science, 289, 1340 [CrossRef] [Google Scholar]
- Kivelson, M. G., Bagenal, F., Kurth, W. S., et al. 2004, in Jupiter: The Planet, Satellites and Magnetosphere, 1, eds. W. B. McKinnon, T. E. Dowling, & F. Bagenal (New York: Cambridge University Press), 513 [NASA ADS] [Google Scholar]
- Kivelson, M. G., Khurana, K. K., & Volwerk, M. 2009, in Europa, 1, eds. K. K. Robert, T. Pappalardo, & William B. McKinnon (Tucson: University of Arizona Press), 545 [Google Scholar]
- Lamy, L. 2016, in Planetary Radio Emissions VIII, 73 [Google Scholar]
- Lamy, L., Zarka, P., Cecconi, B., et al. 2017, ArXiv preprint [arXiv: 1709.03821] [Google Scholar]
- Leblanc, Y., Gerbault, A., Denis, L., & Lecacheux, A. 1993, A&AS, 98, 529 [NASA ADS] [Google Scholar]
- Lebo, G. R., Smith, A. G., & Carr, T. D. 1965, Science, 148, 1724 [CrossRef] [Google Scholar]
- Lecacheux, A. 2000, Radio Astronomy at Long Wavelengths, 119, 321 [CrossRef] [Google Scholar]
- Louis, C. K., Lamy, L., Zarka, P., Cecconi, B., & Hess, S. L. G. 2017, J. Geophys. Res.: Space Phys., 122, 9228 [NASA ADS] [CrossRef] [Google Scholar]
- Louis, C. K., Hess, S. L. G., Cecconi, B., et al. 2019, A&A, 627, A30 [NASA ADS] [CrossRef] [EDP Sciences] [Google Scholar]
- Marques, M. S., Zarka, P., Echer, E., et al. 2017, A&A, 604, A17 [NASA ADS] [CrossRef] [EDP Sciences] [Google Scholar]
- Menietti, J. D., Gurnett, D. A., Kurth, W. S., & Groene, J. B. 1998, Geophys. Res. Lett., 25, 4281 [NASA ADS] [CrossRef] [Google Scholar]
- Menietti, J. D., Gurnett, D. A., & Christopher, I. 2001, Geophys. Res. Lett., 28, 3047 [NASA ADS] [CrossRef] [Google Scholar]
- Neubauer, F. M. 1980, J. Geophys. Res.: Space Phys., 85, 1171 [NASA ADS] [CrossRef] [Google Scholar]
- Piddington, J. H., & Drake, J. F. 1968, Nature, 217, 935 [NASA ADS] [CrossRef] [Google Scholar]
- Roth, L., Saur, J., Retherford, K. D., et al. 2014, Science, 343, 171 [NASA ADS] [CrossRef] [Google Scholar]
- Warwick, J. W., Pearce, J. B., Peltzer, R. G., & Riddle, A. C. 1977, Space Sci. Rev., 21, 309 [NASA ADS] [CrossRef] [Google Scholar]
- Wilson, R. G., Warwick, J. W., Dulk, G. A., & Libby, W. F. 1968, Nature, 220, 1218 [NASA ADS] [CrossRef] [Google Scholar]
- Wu, C. S., & Lee, L. C. 1979, ApJ, 230, 621 [Google Scholar]
- Zarka, P. 1998, J. Geophys. Res.: Planets, 103, 20159 [NASA ADS] [CrossRef] [Google Scholar]
- Zarka, P., Marques, M. S., Louis, C., et al. 2017, in Planetary Radio Emissions VIII, eds. G. Fischer, G. Mann, M. Pachenko, & P. Zarka (Vienna: Austrian Academy of Sciences Press), 45 [Google Scholar]
- Zarka, P., Marques, M. S., Louis, C., et al. 2018, A&A, 618, A84 [NASA ADS] [CrossRef] [EDP Sciences] [Google Scholar]
All Tables
Statistical parameters of maximum frequency and duration distributions of the Io-DAM emission and the Ganymede-DAM emission, and of the non-Io-Ga DAM emission.
Statistical parameters of the maximum frequency and duration distributions of the Europa-induced emission.
All Figures
|
Fig. 1 Occurrence probability of the emission not induced by Io nor by Ganymede as a function of the orbital phases of Io and Ganymede, and the Jovian longitude (CML) of the Earth-Jupiter line. The emission was detected by the NDA from 1990 to 2020. The probability was calculated in 5° × 5° bins (CML × phase) for each component of the Jovian emission (A, B, C, and D). |
| In the text | |
|
Fig. 2 Occurrence probability of the emission not induced by Io nor by Ganymede, separated by their sources, distributed as a function of the CML and Europa’s orbital phase (left). Distribution of the occurrence probability integrated over the entire CML range (0°–360°) (center). Distribution of the occurrence probability integrated over the CML range in which enhanced occurrence is observed (right). The horizontal white lines (in the plots on the left) and the vertical black lines (in the other plots) delimit the phase intervals associated with the Eu-DAM emission detected by Louis et al. (2017). The dashed lines delimit the CML ranges of probability integration shown in the plots on the right. |
| In the text | |
|
Fig. 3 Occurrence probability of all emission not induced by Io nor by Ganymede in the NDA current catalog as a function of Europa phase and of the Jovian CML (a) and the occurrence probability of possible Europa-induced emission as a function of Europa phase and of the CML (b). The (CML, phase) regions associated with the Eu-DAM components are indicated by the white boxes. |
| In the text | |
|
Fig. 4 Distributions of maximum frequency and duration of the emission classified as possible Eu-A, Eu-C and Eu-D. |
| In the text | |
|
Fig. 5 Distributions of intensity (in dB above the Galactic background, and normalized to the average Earth-Jupiter distance of 5.2 AU) of the Ga-DAM emission (a) and the Eu-DAM emission (b) compared to those of the Io-DAM emission and the non-Io-Ga-Eu emission. In (a), the histogram in light blue is the intensity distribution of the Ga-DAM emission multiplied by 7.8 (Zarka et al. 2018) for comparison. |
| In the text | |
|
Fig. 6 Normalized distributions of duration (corrected to the average Earth-Jupiter distance, of 5.2 AU) of the emission induced by Io, Ganymede, Europa, and the emission not induced by either of these satellites (the non-Io-Ga-Eu emission) in the NDA catalog. The distributions were divided by their maximum value in order to have maximum in 1, and were plotted for the estimation of the ratio (α) between the different emission types’ durations. The distributions of the Ga-DAM emission durations multiplied by α are shown with the distributions of duration of the Io-DAM and of the non-Io-Ga-DAM emission in the plots on the left. The distributions of the Eu-DAM emission durations multiplied by α are shown with the distributions of duration of the Io-DAM, of the Ga-DAM, and of the non-Io-Ga-Eu emission in the plots on the right; the value of α was analyzed from 0.5 to 3.0 with steps of 0.5. The value of α in each case is indicated on top of each plot. The thin blue, red, and green lines are bin-to-bin ratios between the distributions. The thick lines in the same colors are lin-log fits to these ratios, and their slopes are indicated on top on each plot, with the respective colors. For Ganymede, the bin-to-bin ratio was computed over the duration range of 15–105 min, and of 15–65 min for Europa. |
| In the text | |
|
Fig. 7 Distributions of duration (in minutes, and corrected to the average Earth-Jupiter distance of 5.2 AU) of the Ga-DAM emission (a) and the Eu-DAM emission (b) compared to those of the Io-DAM emission and the non-Io-Ga-Eu emission. |
| In the text | |
|
Fig. A.1 Distributions of all observations, emission and the occurrence probability of the emission detected by the Nançay Decameter Array from 1990 to 2020. (a) and (b): Number of Jovian observations by the Nançay Decameter Array (NDA) plotted as a function of the Jovian longitude of the observer (CML) and the Io phase (PhIo) (in (a)) or Europa phase (PhEu) (in (b)), in 1° × 1° bins. (c) and (d): Number of emission detected by the NDA in 1° × 1° bins (CML×ΦIo) (in (c)) and (CML×ΦEu) (in (d)). (e) and (f): occurrence probability of all the emission in 1° × 1°. (g) and (h): integration of the emission occurrence probability over the CML range of 210° × 320° as a function of the Europa phase, in 1° bins (in (g)) and in 5° bins (in (h)). This CML range corresponds to the one in plot (f) with most enhanced probability. |
| In the text | |
|
Fig. A.2 Distributions of the observations, emission and the occurrence probability of emission after the removal of those occurring within the Io phase range of 180° – 260°, which corresponds to the phase interval of occurrence of the Io-induced emission from the sources in the dusk (A and C). The distribution of the emission occurrence probability integrated over the CML range of 210° – 320°, plotted as a function of Europa phase, becomes bimodal. |
| In the text | |
Current usage metrics show cumulative count of Article Views (full-text article views including HTML views, PDF and ePub downloads, according to the available data) and Abstracts Views on Vision4Press platform.
Data correspond to usage on the plateform after 2015. The current usage metrics is available 48-96 hours after online publication and is updated daily on week days.
Initial download of the metrics may take a while.