Fig. 2
Download original image
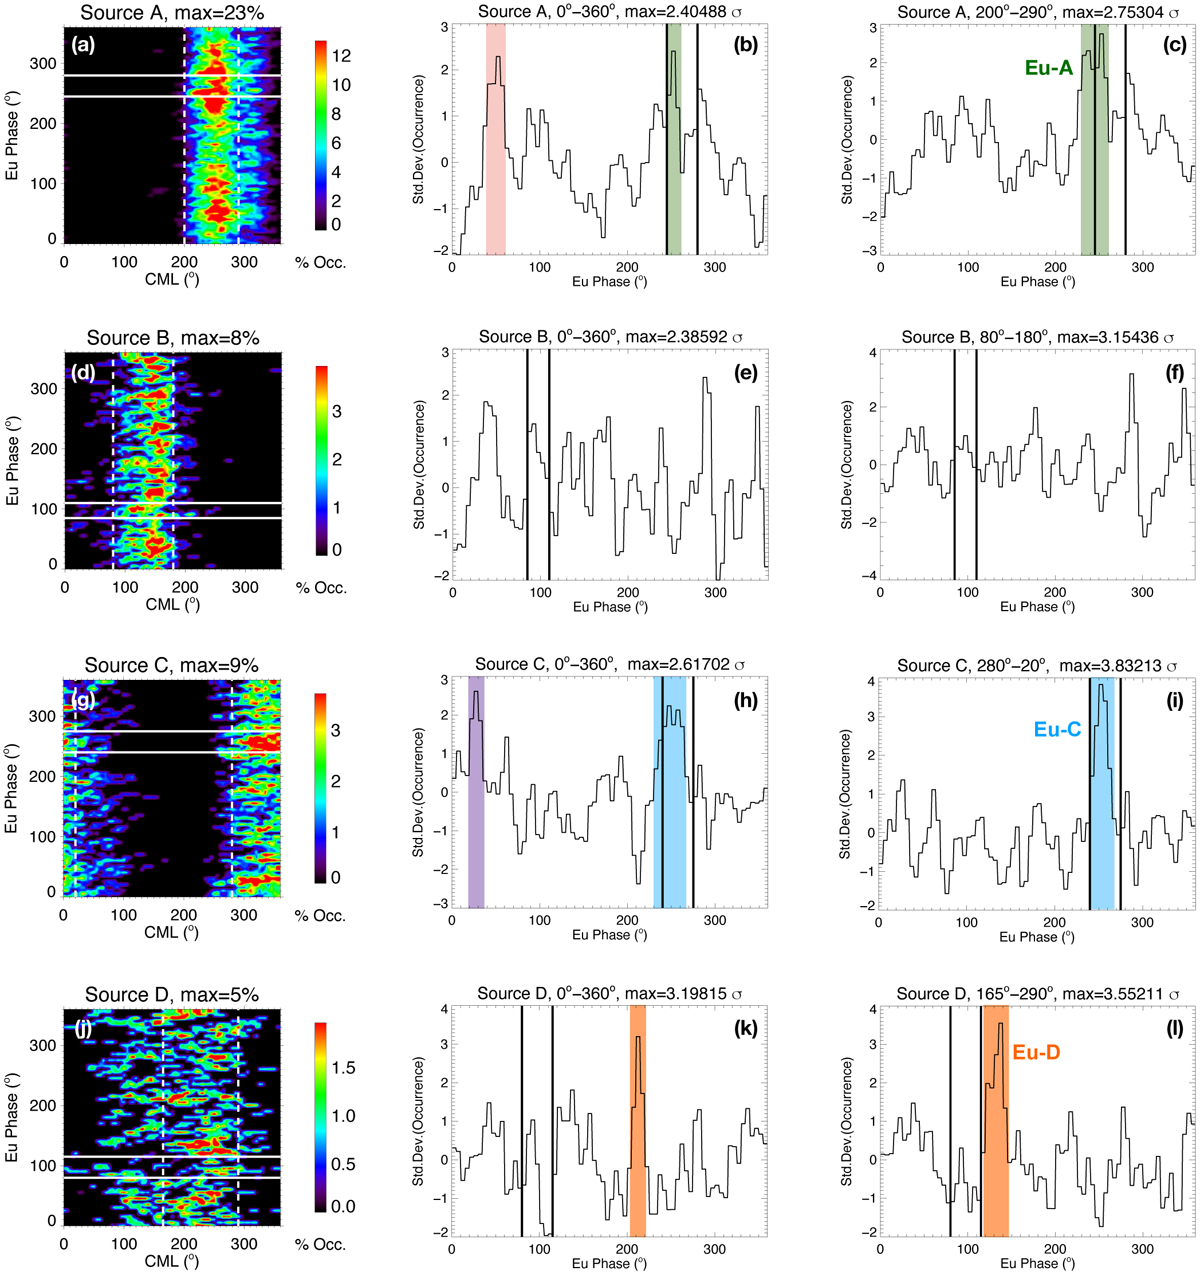
Occurrence probability of the emission not induced by Io nor by Ganymede, separated by their sources, distributed as a function of the CML and Europa’s orbital phase (left). Distribution of the occurrence probability integrated over the entire CML range (0°–360°) (center). Distribution of the occurrence probability integrated over the CML range in which enhanced occurrence is observed (right). The horizontal white lines (in the plots on the left) and the vertical black lines (in the other plots) delimit the phase intervals associated with the Eu-DAM emission detected by Louis et al. (2017). The dashed lines delimit the CML ranges of probability integration shown in the plots on the right.
Current usage metrics show cumulative count of Article Views (full-text article views including HTML views, PDF and ePub downloads, according to the available data) and Abstracts Views on Vision4Press platform.
Data correspond to usage on the plateform after 2015. The current usage metrics is available 48-96 hours after online publication and is updated daily on week days.
Initial download of the metrics may take a while.