Fig. 6
Download original image
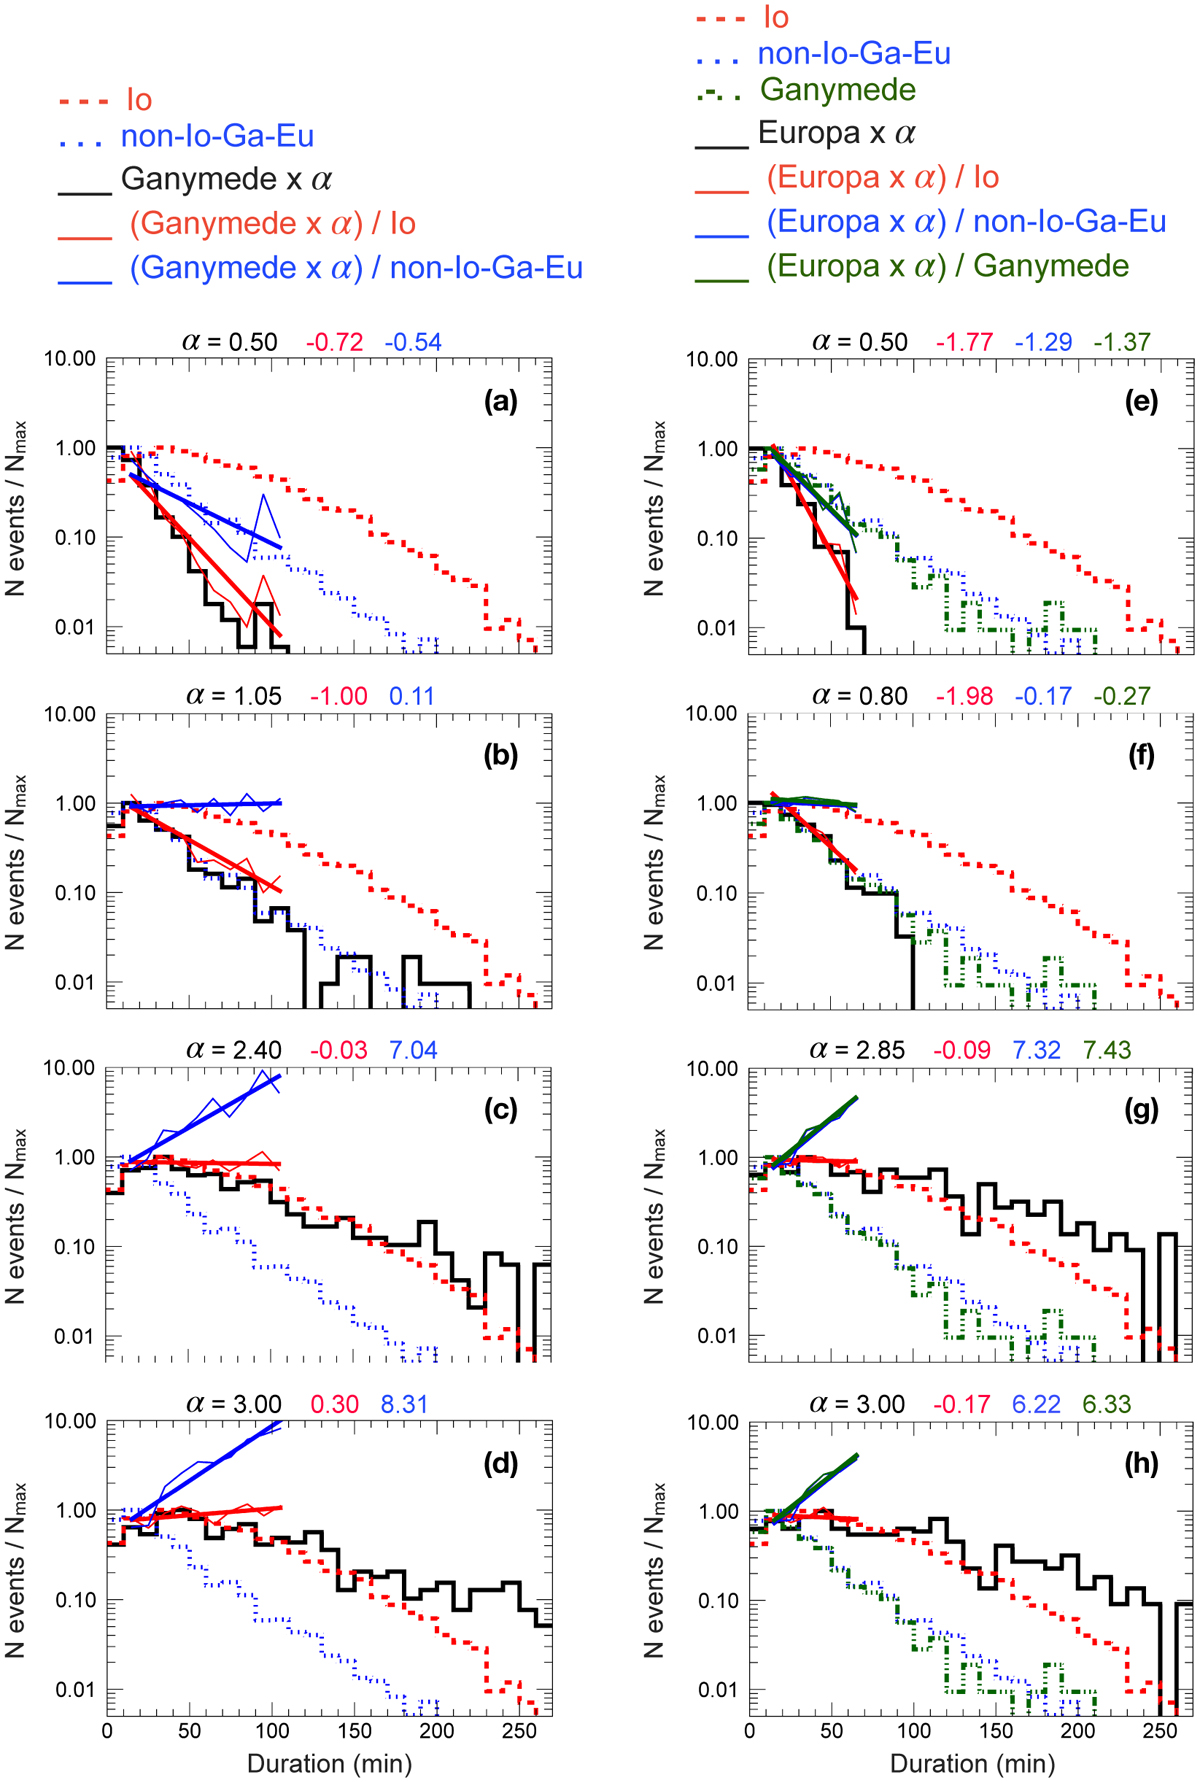
Normalized distributions of duration (corrected to the average Earth-Jupiter distance, of 5.2 AU) of the emission induced by Io, Ganymede, Europa, and the emission not induced by either of these satellites (the non-Io-Ga-Eu emission) in the NDA catalog. The distributions were divided by their maximum value in order to have maximum in 1, and were plotted for the estimation of the ratio (α) between the different emission types’ durations. The distributions of the Ga-DAM emission durations multiplied by α are shown with the distributions of duration of the Io-DAM and of the non-Io-Ga-DAM emission in the plots on the left. The distributions of the Eu-DAM emission durations multiplied by α are shown with the distributions of duration of the Io-DAM, of the Ga-DAM, and of the non-Io-Ga-Eu emission in the plots on the right; the value of α was analyzed from 0.5 to 3.0 with steps of 0.5. The value of α in each case is indicated on top of each plot. The thin blue, red, and green lines are bin-to-bin ratios between the distributions. The thick lines in the same colors are lin-log fits to these ratios, and their slopes are indicated on top on each plot, with the respective colors. For Ganymede, the bin-to-bin ratio was computed over the duration range of 15–105 min, and of 15–65 min for Europa.
Current usage metrics show cumulative count of Article Views (full-text article views including HTML views, PDF and ePub downloads, according to the available data) and Abstracts Views on Vision4Press platform.
Data correspond to usage on the plateform after 2015. The current usage metrics is available 48-96 hours after online publication and is updated daily on week days.
Initial download of the metrics may take a while.