Fig. A.1
Download original image
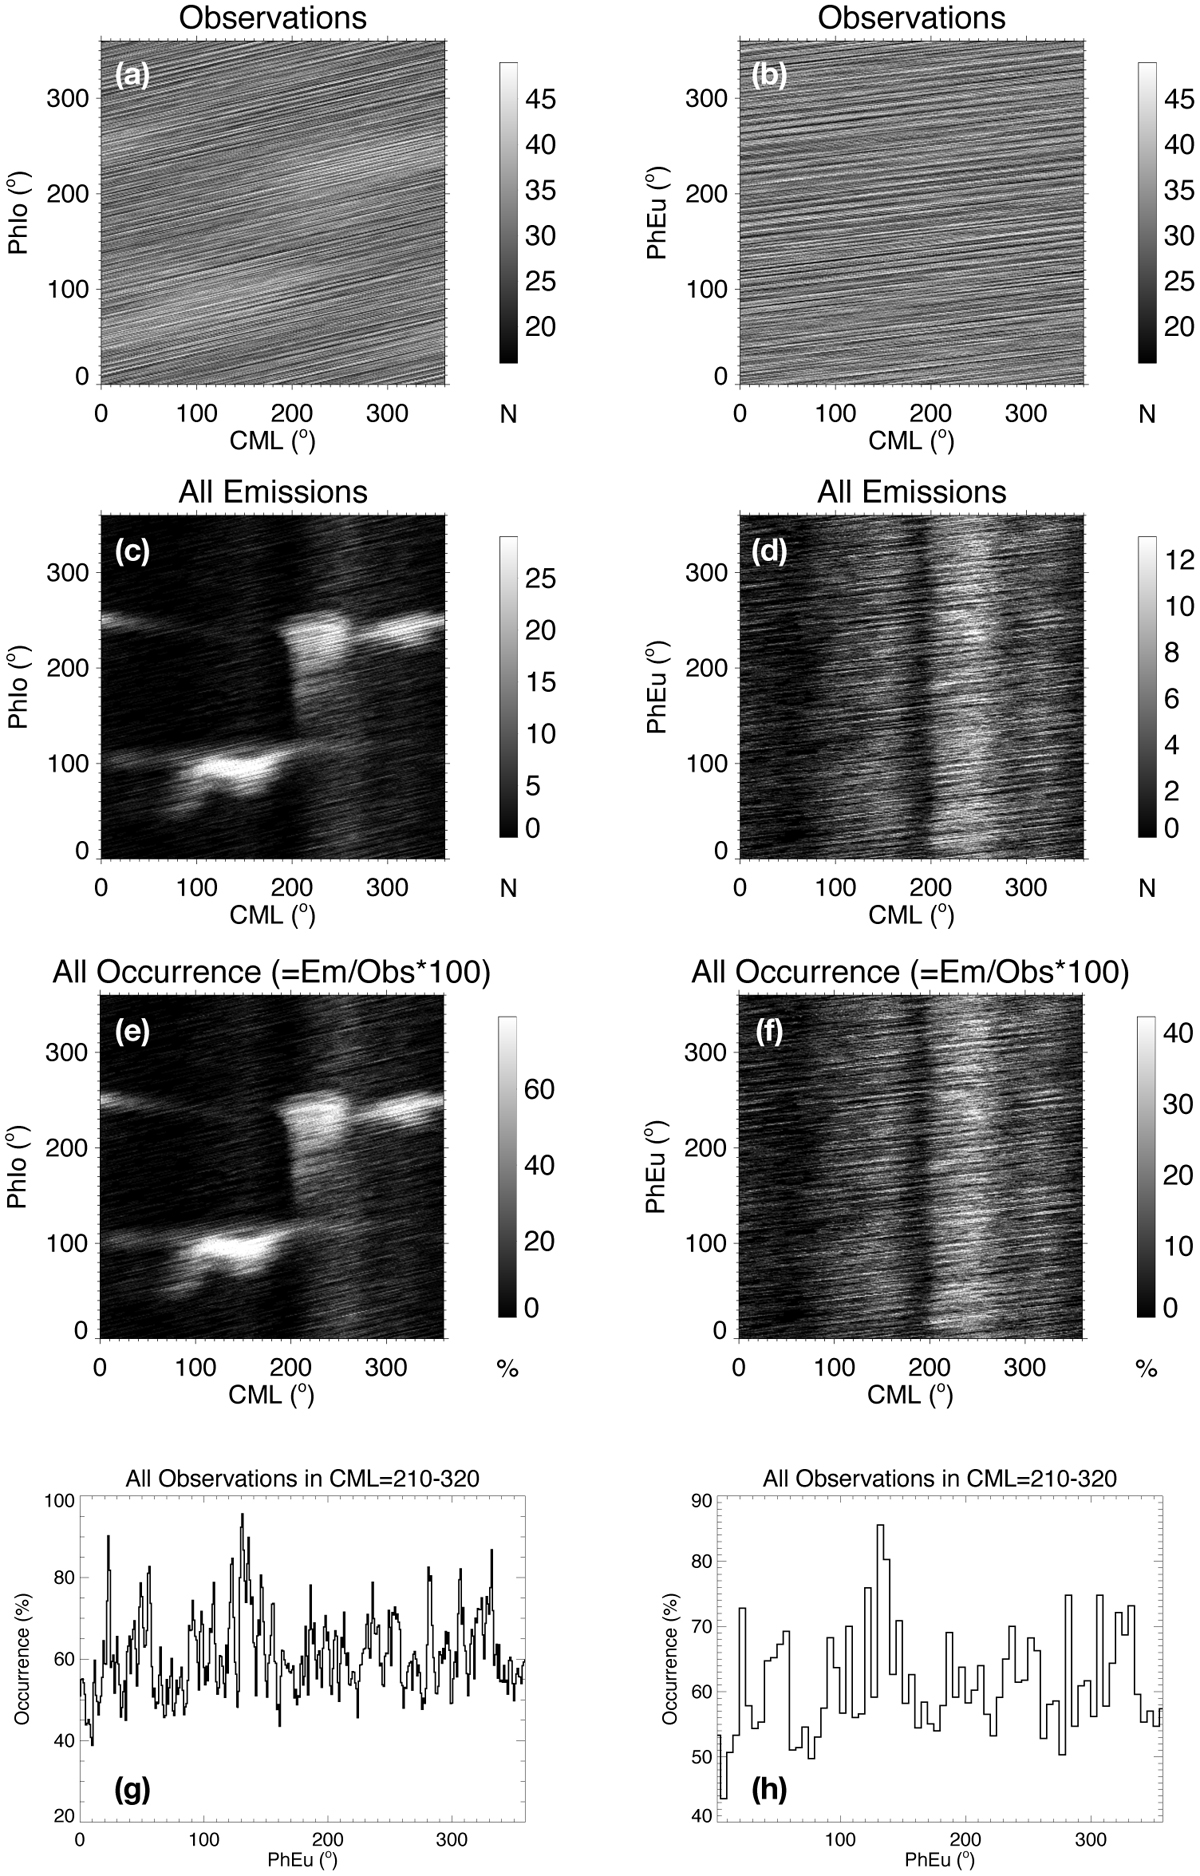
Distributions of all observations, emission and the occurrence probability of the emission detected by the Nançay Decameter Array from 1990 to 2020. (a) and (b): Number of Jovian observations by the Nançay Decameter Array (NDA) plotted as a function of the Jovian longitude of the observer (CML) and the Io phase (PhIo) (in (a)) or Europa phase (PhEu) (in (b)), in 1° × 1° bins. (c) and (d): Number of emission detected by the NDA in 1° × 1° bins (CML×ΦIo) (in (c)) and (CML×ΦEu) (in (d)). (e) and (f): occurrence probability of all the emission in 1° × 1°. (g) and (h): integration of the emission occurrence probability over the CML range of 210° × 320° as a function of the Europa phase, in 1° bins (in (g)) and in 5° bins (in (h)). This CML range corresponds to the one in plot (f) with most enhanced probability.
Current usage metrics show cumulative count of Article Views (full-text article views including HTML views, PDF and ePub downloads, according to the available data) and Abstracts Views on Vision4Press platform.
Data correspond to usage on the plateform after 2015. The current usage metrics is available 48-96 hours after online publication and is updated daily on week days.
Initial download of the metrics may take a while.