Fig. 9.
Download original image
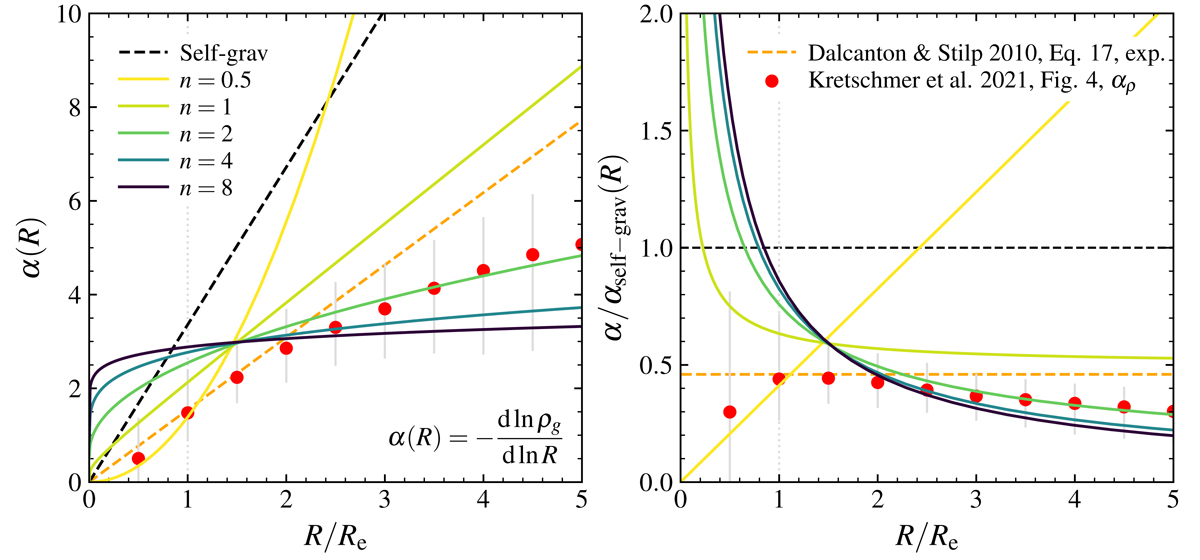
Pressure support correction, α(R), versus R/Re for a self-gravitating exponential disk and deprojected Sérsic models. The left panel directly compares αself − grav(r) = 3.36(R/Re) for the self-gravitating disk (as in Burkert et al. 2010; black dashed line) to α(R, n) = − dlnρ(R, n)/dlnR determined for a range of Sérsic indices n (colored lines). The ratio α/αself − grav(R) is shown in the right panel. For n ≥ 1, α(n) is smaller than αself − grav when R ≳ 0.2 − 0.8Re; however, α(n ≥ 1) does exceed αself − grav at the smallest radii. This implies that for most radii, there is less asymmetric drift correction (and thus higher vrot) for the deprojected Sérsic models (e.g., n = 1) than for the self-gravitating disk. However, for n = 0.5, α(n) is greater than αself − grav at R ≳ 2.4Re, so at large radii the n = 0.5 deprojected Sérsic model predicts a larger pressure support correction than for the self-gravitating disk case. The lower pressure support predicted for α(n ≳ 1) than for αself − grav is in agreement with recent predictions from simulations by Kretschmer et al. (2021) (red circles; with the vertical grey bars denoting the 1σ distribution), as well the relation by Dalcanton & Stilp (2010) for a power law relationship between the gas surface density and the turbulent pressure (orange dashed line).
Current usage metrics show cumulative count of Article Views (full-text article views including HTML views, PDF and ePub downloads, according to the available data) and Abstracts Views on Vision4Press platform.
Data correspond to usage on the plateform after 2015. The current usage metrics is available 48-96 hours after online publication and is updated daily on week days.
Initial download of the metrics may take a while.