Fig. 8.
Download original image
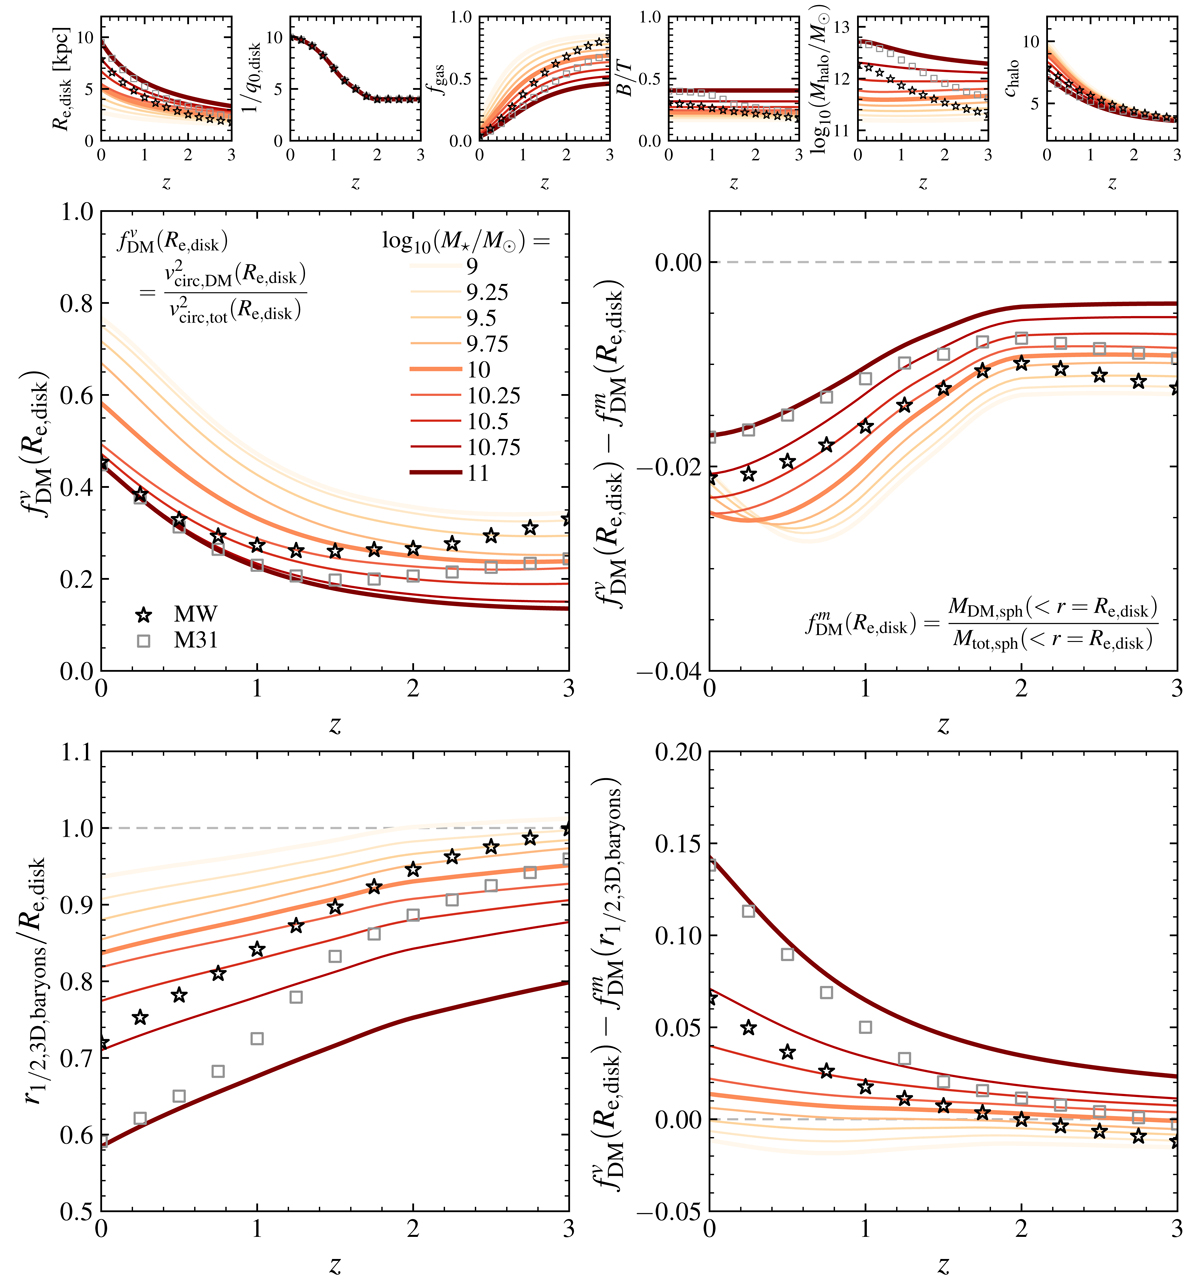
Toy model of how ![]() (upper left),
(upper left), ![]() (upper right), r1/2, 3D, baryons/Re, disk (lower left), and
(upper right), r1/2, 3D, baryons/Re, disk (lower left), and ![]() (lower right) vary with redshift for a range of fixed log10(M*/M⊙), using “typical” galaxy sizes, intrinsic axis ratios, gas fractions, B/T ratios, halo masses, and halo concentrations (from empirical scaling relations or other estimates; Dutton & Macciò 2014; Lang et al. 2014; van der Wel et al. 2014; Moster et al. 2018; Übler et al. 2019; Tacconi et al. 2020; Genzel et al. 2020). The assumed (interpolated, extrapolated) property profiles as a function of redshift for each of the fixed log10(M*/M⊙) are shown in the top panels. Using abundance-matching models (inferred from Fig. 4 of Papovich et al. 2015, based on the models of Moster et al. 2013), we show the path of a Milky Way (MW, M* = 5 × 10¹⁰ M⊙ at z = 0; black stars) and M31 progenitor (M* = 1011 M⊙ at z = 0; grey squares) over time in each of the panels, assuming the progenitors are “typical” at all times. This inferred “typical” evolution would predict an increase in fDM(Re, disk) with time at fixed M*, with lower masses having higher fDM at all z. The evolution of the structure and relative masses of the disk, bulge, and halo predict an increase (M* ≳ 1010.25 M⊙) or “dip” (M* ≲ 1010.25 M⊙) in the difference
(lower right) vary with redshift for a range of fixed log10(M*/M⊙), using “typical” galaxy sizes, intrinsic axis ratios, gas fractions, B/T ratios, halo masses, and halo concentrations (from empirical scaling relations or other estimates; Dutton & Macciò 2014; Lang et al. 2014; van der Wel et al. 2014; Moster et al. 2018; Übler et al. 2019; Tacconi et al. 2020; Genzel et al. 2020). The assumed (interpolated, extrapolated) property profiles as a function of redshift for each of the fixed log10(M*/M⊙) are shown in the top panels. Using abundance-matching models (inferred from Fig. 4 of Papovich et al. 2015, based on the models of Moster et al. 2013), we show the path of a Milky Way (MW, M* = 5 × 10¹⁰ M⊙ at z = 0; black stars) and M31 progenitor (M* = 1011 M⊙ at z = 0; grey squares) over time in each of the panels, assuming the progenitors are “typical” at all times. This inferred “typical” evolution would predict an increase in fDM(Re, disk) with time at fixed M*, with lower masses having higher fDM at all z. The evolution of the structure and relative masses of the disk, bulge, and halo predict an increase (M* ≳ 1010.25 M⊙) or “dip” (M* ≲ 1010.25 M⊙) in the difference ![]() between z ∼ 0 and z ∼ 0.75, and then an increase until z ∼ 2 when the difference flattens (largely reflecting the flat q0, disk estimate for z ≳ 2). The difference is minor, between ∼ − 0.025 and −0.005 for the stellar masses shown. The ratio of the composite r1/2, 3D, baryons/Re, disk increases with redshift for all masses, with more massive models predicting smaller ratios at each z. The MW and M31 progenitors have fDM(Re, disk) evolving from ∼0.33 and ∼0.25 (respectively) at z = 3, decreasing to ∼0.25 and ∼0.2 at z ∼ 1.5, and then increasing to roughly same value ∼0.45 at z = 0. The
between z ∼ 0 and z ∼ 0.75, and then an increase until z ∼ 2 when the difference flattens (largely reflecting the flat q0, disk estimate for z ≳ 2). The difference is minor, between ∼ − 0.025 and −0.005 for the stellar masses shown. The ratio of the composite r1/2, 3D, baryons/Re, disk increases with redshift for all masses, with more massive models predicting smaller ratios at each z. The MW and M31 progenitors have fDM(Re, disk) evolving from ∼0.33 and ∼0.25 (respectively) at z = 3, decreasing to ∼0.25 and ∼0.2 at z ∼ 1.5, and then increasing to roughly same value ∼0.45 at z = 0. The ![]() and
and ![]() values are relatively similar down to z ∼ 1.5, but at lower redshifts (where r1/2, 3D, baryons/Re, disk ≲ 0.9) the difference increases up to ∼0.065 (MW) and ∼0.14 (M31) at z ∼ 0. While this “typical” case predicts fDM offsets of only 0.035 at z = 2 and increasing to 0.14 at z ∼ 0 for the most massive case, objects with even larger bulges (B/T > 0.4) or radii above the mass-size relation will have even more discrepant fDM values when adopting these radii definitions (see Fig. 7).
values are relatively similar down to z ∼ 1.5, but at lower redshifts (where r1/2, 3D, baryons/Re, disk ≲ 0.9) the difference increases up to ∼0.065 (MW) and ∼0.14 (M31) at z ∼ 0. While this “typical” case predicts fDM offsets of only 0.035 at z = 2 and increasing to 0.14 at z ∼ 0 for the most massive case, objects with even larger bulges (B/T > 0.4) or radii above the mass-size relation will have even more discrepant fDM values when adopting these radii definitions (see Fig. 7).
Current usage metrics show cumulative count of Article Views (full-text article views including HTML views, PDF and ePub downloads, according to the available data) and Abstracts Views on Vision4Press platform.
Data correspond to usage on the plateform after 2015. The current usage metrics is available 48-96 hours after online publication and is updated daily on week days.
Initial download of the metrics may take a while.