Fig. 7.
Download original image
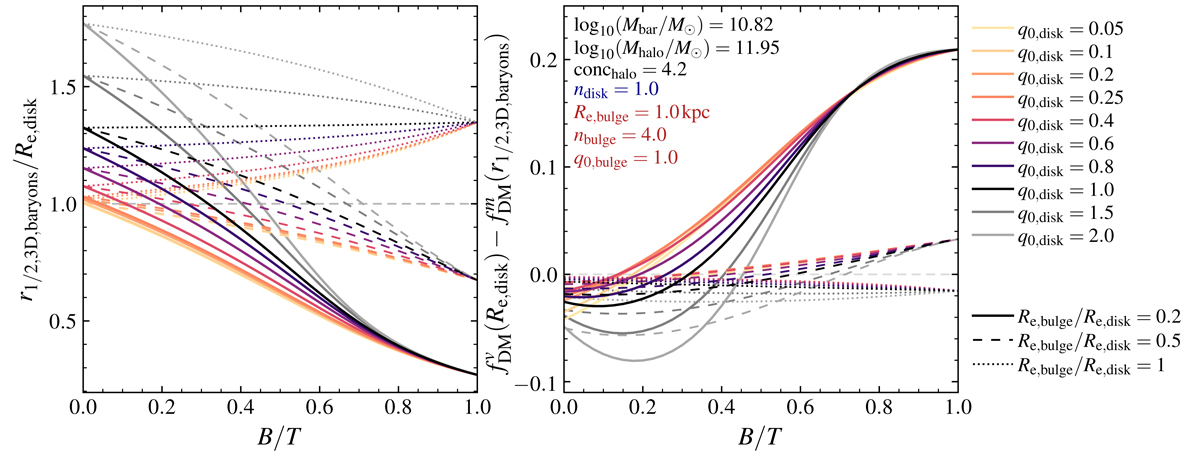
Ratio between the composite disk+bulge 3D half-mass radius and the 2D projected disk effective radius (r1/2, 3D, baryons/Re, disk; left) and the difference between the dark matter fraction estimators at these radii (![]() ; right), as a function of B/T, for a range of disk intrinsic axis ratios (colored lines, from q0, disk = 0.05 to 2) and ratio between the bulge and disk Re (solid, dashed, and dotted lines, for Re, bulge/Re, disk = 0.2, 0.5, 1, respectively). The adopted galaxy values are the same as in Fig. 6, except Re, disk is now determined by Re, bulge/Re, disk. With a non-zero bulge contribution, r1/2, 3D, baryons/Re, disk deviates from the single-component ratio (Fig. 2), decreasing with increasing B/T for Re, disk = 2, 5 kpc for all q0, disk (increasing, however, with B/T when q0 < 1, Re, disk = Re, bulge = 1 kpc). For large B/T and Re, disk = 5 kpc, the composite r1/2, 3D, baryons is less than 50% of Re, disk. If the dark matter fractions are measured at different radii, the mismatch of the aperture sizes will lead to much larger fDM differences than those found for the simple estimator mismatch (
; right), as a function of B/T, for a range of disk intrinsic axis ratios (colored lines, from q0, disk = 0.05 to 2) and ratio between the bulge and disk Re (solid, dashed, and dotted lines, for Re, bulge/Re, disk = 0.2, 0.5, 1, respectively). The adopted galaxy values are the same as in Fig. 6, except Re, disk is now determined by Re, bulge/Re, disk. With a non-zero bulge contribution, r1/2, 3D, baryons/Re, disk deviates from the single-component ratio (Fig. 2), decreasing with increasing B/T for Re, disk = 2, 5 kpc for all q0, disk (increasing, however, with B/T when q0 < 1, Re, disk = Re, bulge = 1 kpc). For large B/T and Re, disk = 5 kpc, the composite r1/2, 3D, baryons is less than 50% of Re, disk. If the dark matter fractions are measured at different radii, the mismatch of the aperture sizes will lead to much larger fDM differences than those found for the simple estimator mismatch (![]() vs
vs ![]() at the same radius; Fig. 6). Here, we show
at the same radius; Fig. 6). Here, we show ![]() , as might be adopted for modeling of observations, and
, as might be adopted for modeling of observations, and ![]() , representing a simple option for simulations (where spherical curves of growth separating gas, star, and DM particles could be used to find both the composite baryon r1/2, 3D, baryons within, e.g., Rvir and then
, representing a simple option for simulations (where spherical curves of growth separating gas, star, and DM particles could be used to find both the composite baryon r1/2, 3D, baryons within, e.g., Rvir and then ![]() ). For small B/T,
). For small B/T, ![]() is larger than
is larger than ![]() , but for large B/T, the trend reverses (excepting the Re, disk = Re, bulge = 1 kpc case), and
, but for large B/T, the trend reverses (excepting the Re, disk = Re, bulge = 1 kpc case), and ![]() can be up to 50%–400% larger than
can be up to 50%–400% larger than ![]() as B/T → 1 (for Re, disk = 2, 5 kpc, respectively). This example illustrates how, depending on galaxy structures, quoted “half-mass” fDM values can be very different – but that this is primarily driven by the aperture radii definitions and not by estimator mismatches.
as B/T → 1 (for Re, disk = 2, 5 kpc, respectively). This example illustrates how, depending on galaxy structures, quoted “half-mass” fDM values can be very different – but that this is primarily driven by the aperture radii definitions and not by estimator mismatches.
Current usage metrics show cumulative count of Article Views (full-text article views including HTML views, PDF and ePub downloads, according to the available data) and Abstracts Views on Vision4Press platform.
Data correspond to usage on the plateform after 2015. The current usage metrics is available 48-96 hours after online publication and is updated daily on week days.
Initial download of the metrics may take a while.