Fig. 5.
Download original image
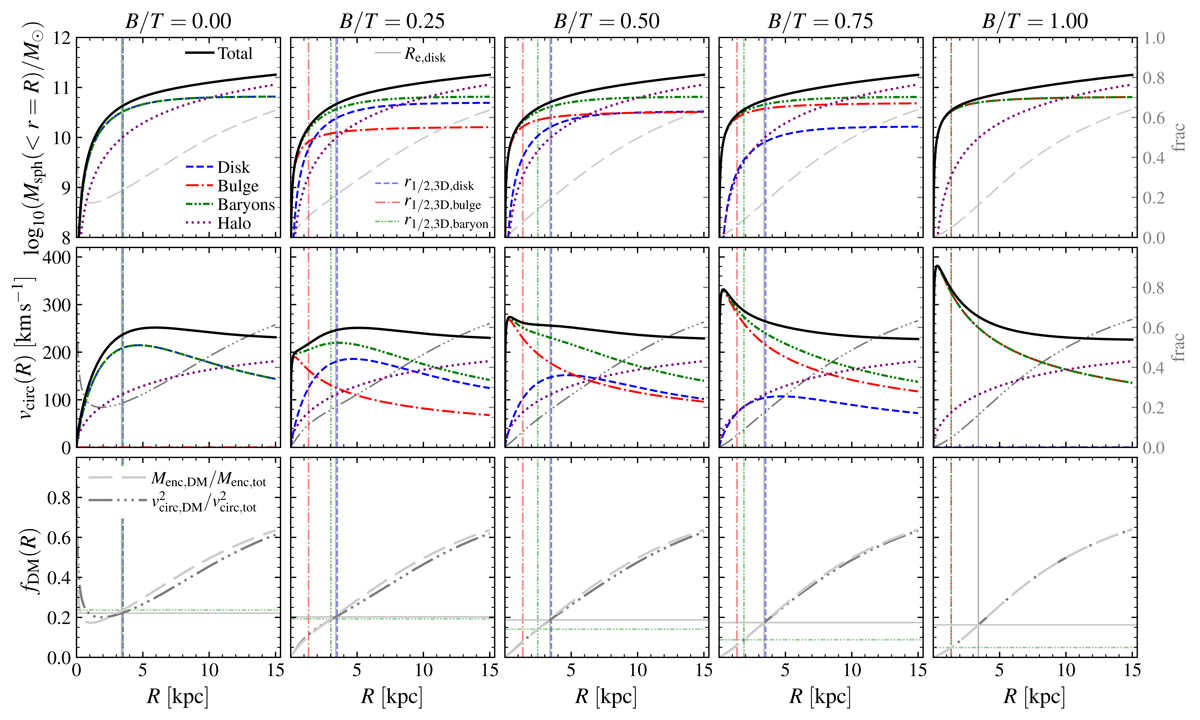
Enclosed mass (3D spherical, top), circular velocity (middle), and dark matter (bottom) profiles for different components of an example galaxy as a function of projected major axis radius, for bulge-to-total ratios of B/T = 0, 0.25, 0.5, 0.75, 1 (left to right). For all cases, we compute the mass components assuming values for a typical z = 2 massive main-sequence galaxy with log10(M*/M⊙) = 10.5: Mbar = 6.6 × 10¹⁰ M⊙, Re, disk = 3.4 kpc, ndisk = 1, q0, disk = 0.25, Re, bulge = 1 kpc, nbulge = 4, q0, bulge = 1, and a NFW halo with Mhalo = 8.9 × 10¹¹ M⊙ and c = 4.2. Shown are the Msph(< r = R) and vcirc(R) profiles for the disk (dashed blue), bulge (dash-dotted red), total baryons (disk+bulge; dash-dot-dot green), halo (dotted purple), and composite total system (solid black). Vertical lines mark R = Re, disk (solid grey) and the 3D spherical half-mass radii r1/2, mass, 3D for the disk (dashed blue), bulge (dash-dotted red), and total baryons (dash-dot-dot green). Two dark matter fraction definitions are shown in the bottom panels, ![]() and
and ![]() , with long dashed grey and long dash-triple-dotted dark grey lines, respectively. We note that the
, with long dashed grey and long dash-triple-dotted dark grey lines, respectively. We note that the ![]() and
and ![]() curves are also shown in the top and middle panels, respectively, with the scale at the right axis of each panel. When a disk component is present, the system is no longer spherically symmetric, so MDM, sph/Mtot, sph and
curves are also shown in the top and middle panels, respectively, with the scale at the right axis of each panel. When a disk component is present, the system is no longer spherically symmetric, so MDM, sph/Mtot, sph and ![]() differ. This deviation is larger when the disk contribution is large (i.e., lower B/T), although even at low B/T the difference is relatively modest (see also Fig. 6). Additionally, while the ratio r1/2, mass, 3D/Re for a single component (e.g., the disk or bulge) is generally modest (see Fig. 2), for a composite disk+bulge system, the total baryon r1/2, 3D, baryon becomes much smaller relative to Re, disk with increasing B/T (vertical green dash-dot-dot and solid grey lines). If such disparate “half” radii definitions are used to define fDM apertures (i.e.,
differ. This deviation is larger when the disk contribution is large (i.e., lower B/T), although even at low B/T the difference is relatively modest (see also Fig. 6). Additionally, while the ratio r1/2, mass, 3D/Re for a single component (e.g., the disk or bulge) is generally modest (see Fig. 2), for a composite disk+bulge system, the total baryon r1/2, 3D, baryon becomes much smaller relative to Re, disk with increasing B/T (vertical green dash-dot-dot and solid grey lines). If such disparate “half” radii definitions are used to define fDM apertures (i.e., ![]() versus
versus ![]() , horizontal solid grey and green dash-dot-dot lines), this leads to increasingly large offsets between the fDM values towards higher B/T (see also Fig. 7).
, horizontal solid grey and green dash-dot-dot lines), this leads to increasingly large offsets between the fDM values towards higher B/T (see also Fig. 7).
Current usage metrics show cumulative count of Article Views (full-text article views including HTML views, PDF and ePub downloads, according to the available data) and Abstracts Views on Vision4Press platform.
Data correspond to usage on the plateform after 2015. The current usage metrics is available 48-96 hours after online publication and is updated daily on week days.
Initial download of the metrics may take a while.