Fig. 3.
Download original image
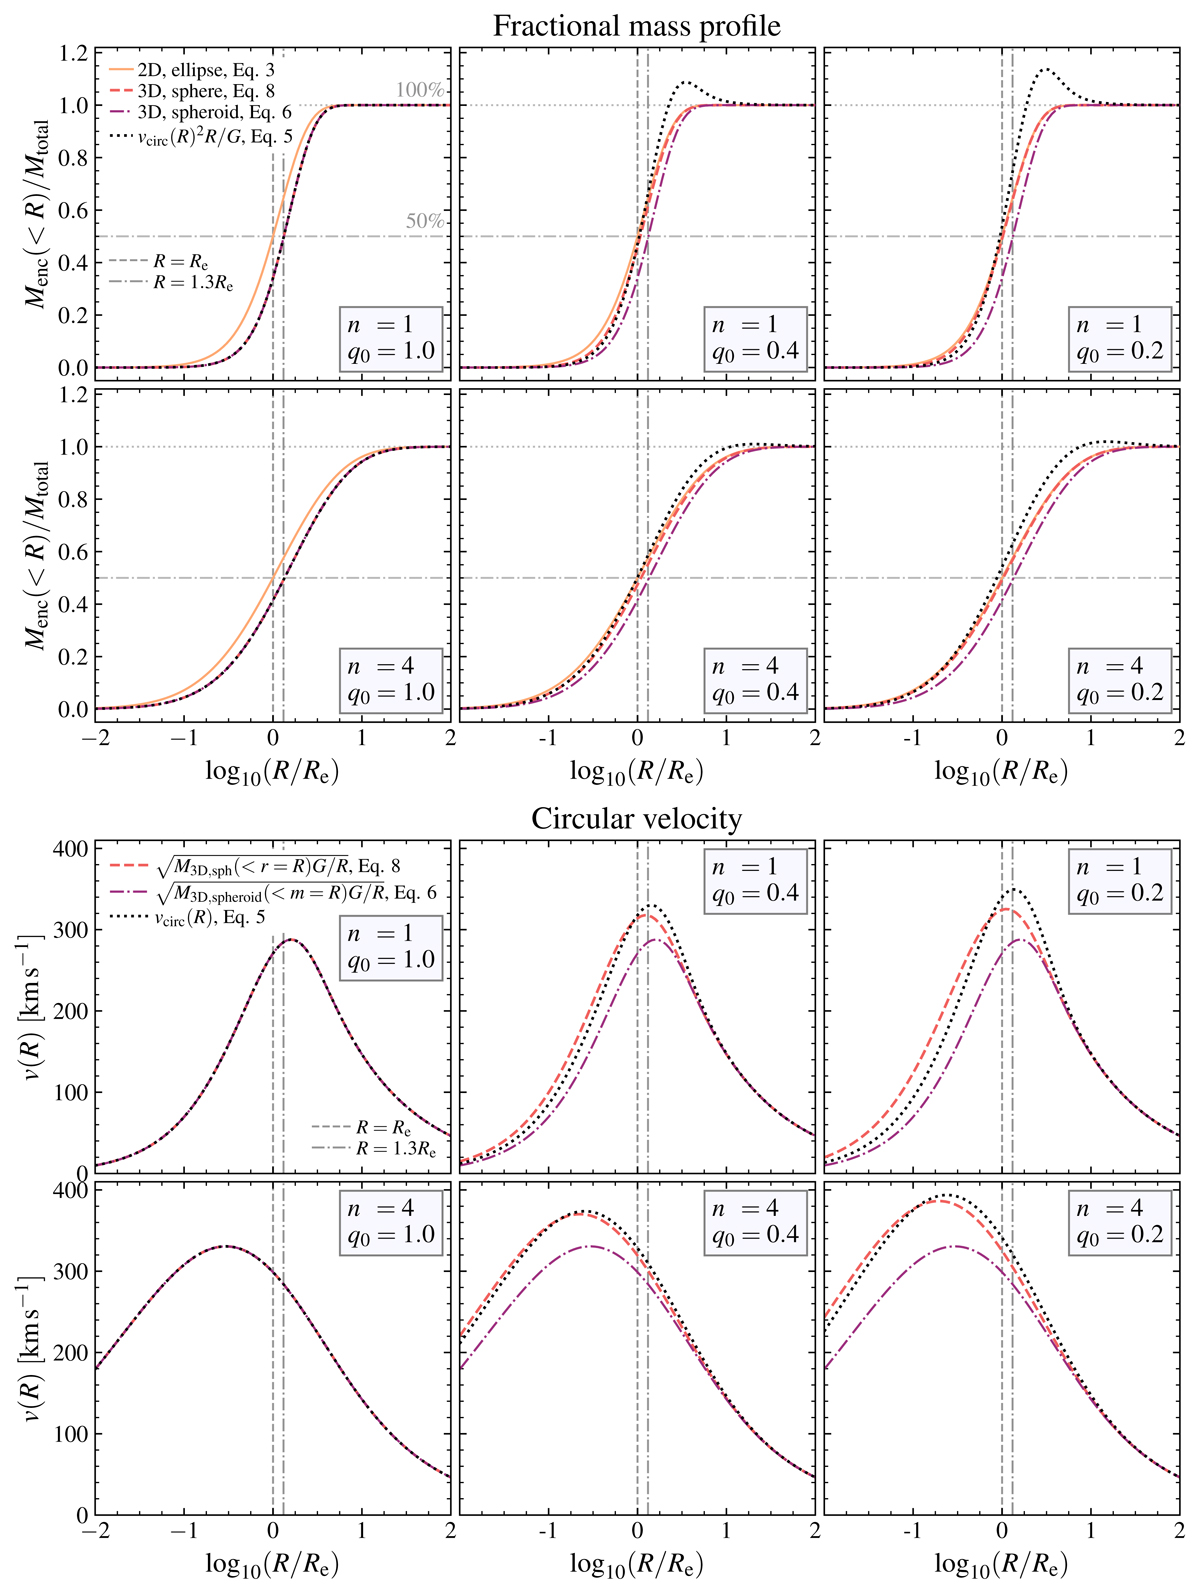
Example fractional enclosed mass (top) and circular velocity (bottom) profiles computed or inferred under different assumptions. The top and bottom rows show the profiles for Sérsic indices n = 1, 4, respectively, while the columns show intrinsic axis ratios q0 = 1, 0.4, 0.2 (from left to right). For the top panels, we show the edge-on 2D projected mass enclosed within ellipses of axis ratio q0 (orange solid line), the 3D mass profile enclosed within a sphere (red dashed line), the 3D mass profile enclosed within ellipsoids of intrinsic axis ratio q0 (purple dash-dotted line), and the mass profile inferred from the flattened deprojected Sérsic model circular velocity under the simplifying assumption of spherical symmetry (i.e., q0 = 1; black dotted line). In the bottom panels, we then compare the flattened deprojected Sérsic model circular velocity (black dotted line) to the inferred velocity profiles computed from the 3D spherical (red solid line) and the 3D ellipsoidal (purple dash-dotted) mass profiles under the simple assumption of spherical symmetry. The same total mass Mtot = 5 × 10¹⁰ M⊙ is used for all cases. The vertical lines denote R = Re (grey dashed) and R = 1.3Re (≈r1/2, mass, 3D for q0 = 1; grey dash-dotted). These enclosed mass and velocity profiles demonstrate that when q0 ≠ 1, Msph(< r = R)≠vcirc(R)2R/G. The non-spherical potentials for q0 < 1 even result in (vcirc(R)2R/G)/Mtot > 1 between R ∼ 1 − 10Re (i.e., potentially leading to ≳15% overestimates in the system mass). We also see that as q0 decreases, Msph approaches the 2D projected mass profile, as the mass enclosed in a sphere versus an infinite ellipsoidal cylinder are equivalent for infinitely thin mass distributions.
Current usage metrics show cumulative count of Article Views (full-text article views including HTML views, PDF and ePub downloads, according to the available data) and Abstracts Views on Vision4Press platform.
Data correspond to usage on the plateform after 2015. The current usage metrics is available 48-96 hours after online publication and is updated daily on week days.
Initial download of the metrics may take a while.