Fig. 10.
Download original image
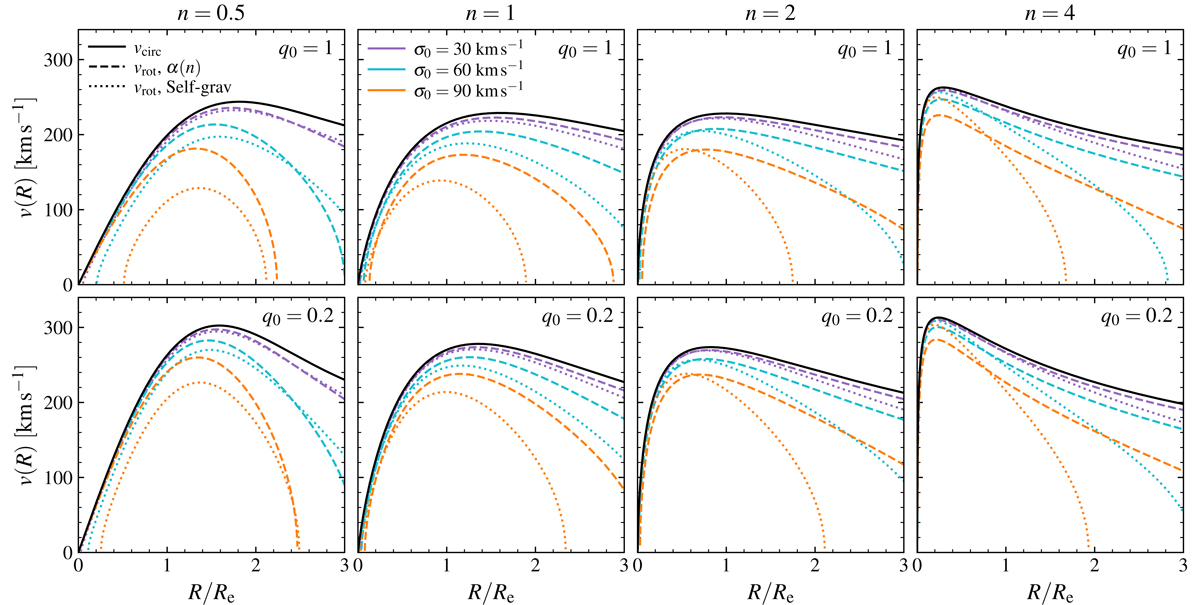
Comparison between ![]() determined using the deprojected Sérsic model α(n) and the self-gravitating exponential disk αself − grav (as shown in Fig. 9), for a range of Sérsic indices n, intrinsic axis ratios q0, and velocity dispersions σ0. For all cases, we consider a single deprojected Sérsic mass distribution with Mtot = 1010.5 M⊙. The columns show curves for n = 0.5, 1, 2, 4 (left to right, respectively), while the rows show the case of spherical (q0 = 1; top) and flattened (q0 = 0.2; bottom) Sérsic distributions. For each panel, the solid black line shows the circular velocity vcirc (determined following Eq. (5)). The colored lines show vrot determined using α(n) (dashed) and αself − grav (dotted), with the colors denoting σ0 = [30, 60, 90] km s−1 (purple, turquoise, orange, respectively). As expected by the α(R) trends shown in Fig. 9, for n ≥ 1, we see that for most radii, the pressure support implied by αself − grav results in lower vrot than for α(n) (although at the smallest radii, the inverse holds). In some cases, the magnitude of σ0 combined with the form of α(R) additionally predict disk truncation within the range shown, although truncation generally occurs at smaller radii for αself − grav than for α(n).
determined using the deprojected Sérsic model α(n) and the self-gravitating exponential disk αself − grav (as shown in Fig. 9), for a range of Sérsic indices n, intrinsic axis ratios q0, and velocity dispersions σ0. For all cases, we consider a single deprojected Sérsic mass distribution with Mtot = 1010.5 M⊙. The columns show curves for n = 0.5, 1, 2, 4 (left to right, respectively), while the rows show the case of spherical (q0 = 1; top) and flattened (q0 = 0.2; bottom) Sérsic distributions. For each panel, the solid black line shows the circular velocity vcirc (determined following Eq. (5)). The colored lines show vrot determined using α(n) (dashed) and αself − grav (dotted), with the colors denoting σ0 = [30, 60, 90] km s−1 (purple, turquoise, orange, respectively). As expected by the α(R) trends shown in Fig. 9, for n ≥ 1, we see that for most radii, the pressure support implied by αself − grav results in lower vrot than for α(n) (although at the smallest radii, the inverse holds). In some cases, the magnitude of σ0 combined with the form of α(R) additionally predict disk truncation within the range shown, although truncation generally occurs at smaller radii for αself − grav than for α(n).
Current usage metrics show cumulative count of Article Views (full-text article views including HTML views, PDF and ePub downloads, according to the available data) and Abstracts Views on Vision4Press platform.
Data correspond to usage on the plateform after 2015. The current usage metrics is available 48-96 hours after online publication and is updated daily on week days.
Initial download of the metrics may take a while.