Fig. 7
Download original image
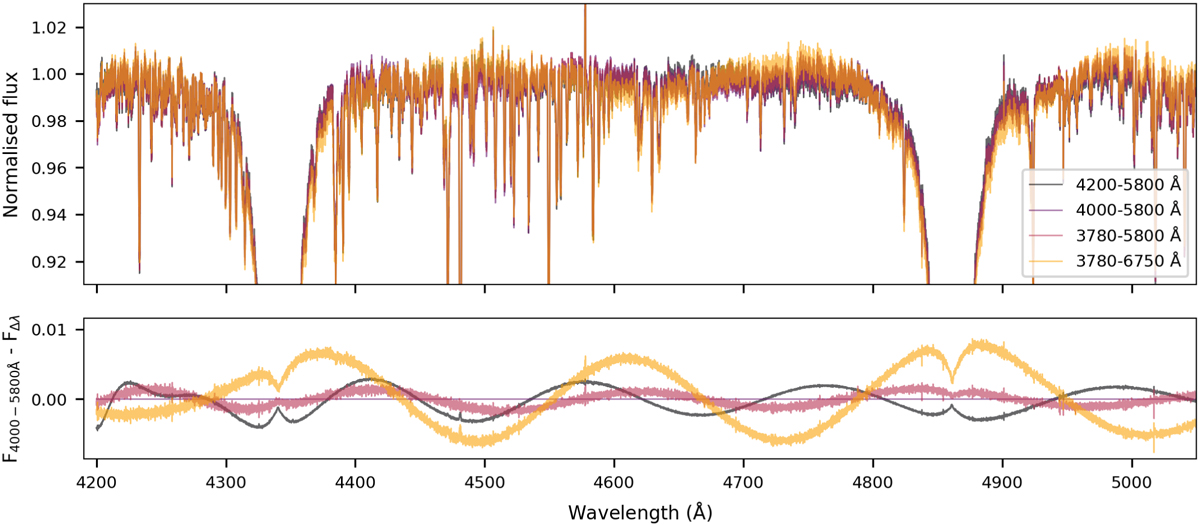
Comparison of the normalisation quality when different wavelength regions are analysed. Top panel: spectra computed in the 4200–5800 Å (black), 4000–5800 Å (purple), 3780–5800 Å (red), 3780–6750 Å (yellow) wavelength regions are shown. The bottom panel shows the differences between the spectrum computed in the 4000–5800 Å range and those computed in the other wavelength regions as indicated by the same colours as in the top panel.
Current usage metrics show cumulative count of Article Views (full-text article views including HTML views, PDF and ePub downloads, according to the available data) and Abstracts Views on Vision4Press platform.
Data correspond to usage on the plateform after 2015. The current usage metrics is available 48-96 hours after online publication and is updated daily on week days.
Initial download of the metrics may take a while.