Fig. 6
Download original image
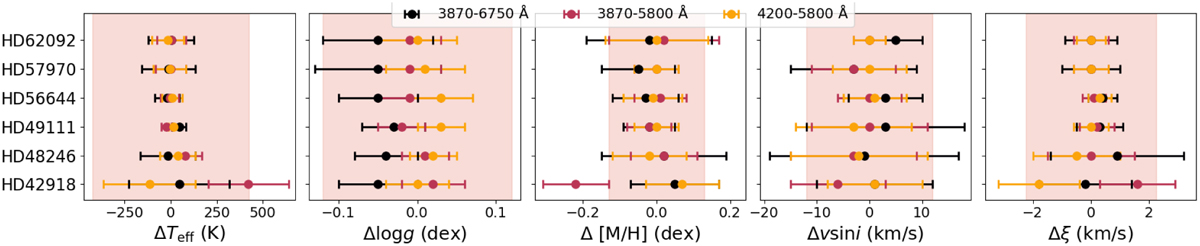
Comparison of stellar parameters derived from different wavelength regions. From left to right the differences in Teff, log g, [M/H], v sin i and ξ are shown. Black, red, and yellow dots are the differences between the parameter value obtained from the 4000–5800 Å spectral range and the parameter value obtained from the wavelength range indicated with the respective colour in the legend of the figure, so p4000–5800Å−p∆λ. The pink region indicates the internal uncertainty interval from Table 2. The systematic offset (insignificant within the internal uncertainty) in the log g parameter is discussed in detail in Sect. 4.4.
Current usage metrics show cumulative count of Article Views (full-text article views including HTML views, PDF and ePub downloads, according to the available data) and Abstracts Views on Vision4Press platform.
Data correspond to usage on the plateform after 2015. The current usage metrics is available 48-96 hours after online publication and is updated daily on week days.
Initial download of the metrics may take a while.