Fig. 5
Download original image
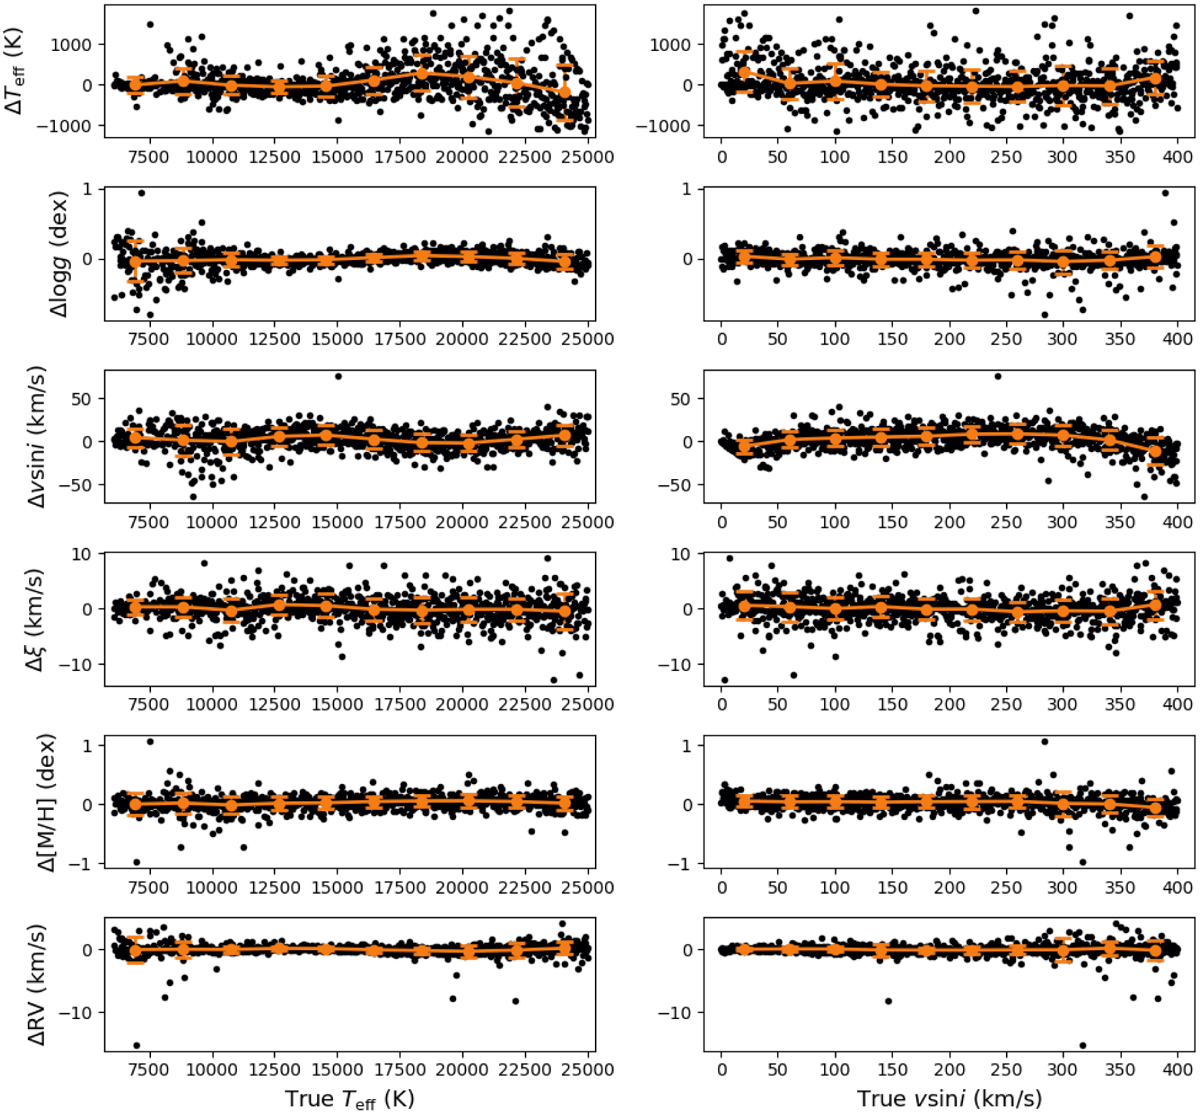
Internal uncertainties for 1000 synthetic noiseless FEROS spectra. The left panels show the difference between parameters predicted with zeta-Payne and the true values of the synthetic spectra as a function of Teff and the right panels show this difference as a function of v sin i. The orange dots are the average uncertainties with standard deviation in bins of Teff and v sin i.
Current usage metrics show cumulative count of Article Views (full-text article views including HTML views, PDF and ePub downloads, according to the available data) and Abstracts Views on Vision4Press platform.
Data correspond to usage on the plateform after 2015. The current usage metrics is available 48-96 hours after online publication and is updated daily on week days.
Initial download of the metrics may take a while.