Fig. 10
Download original image
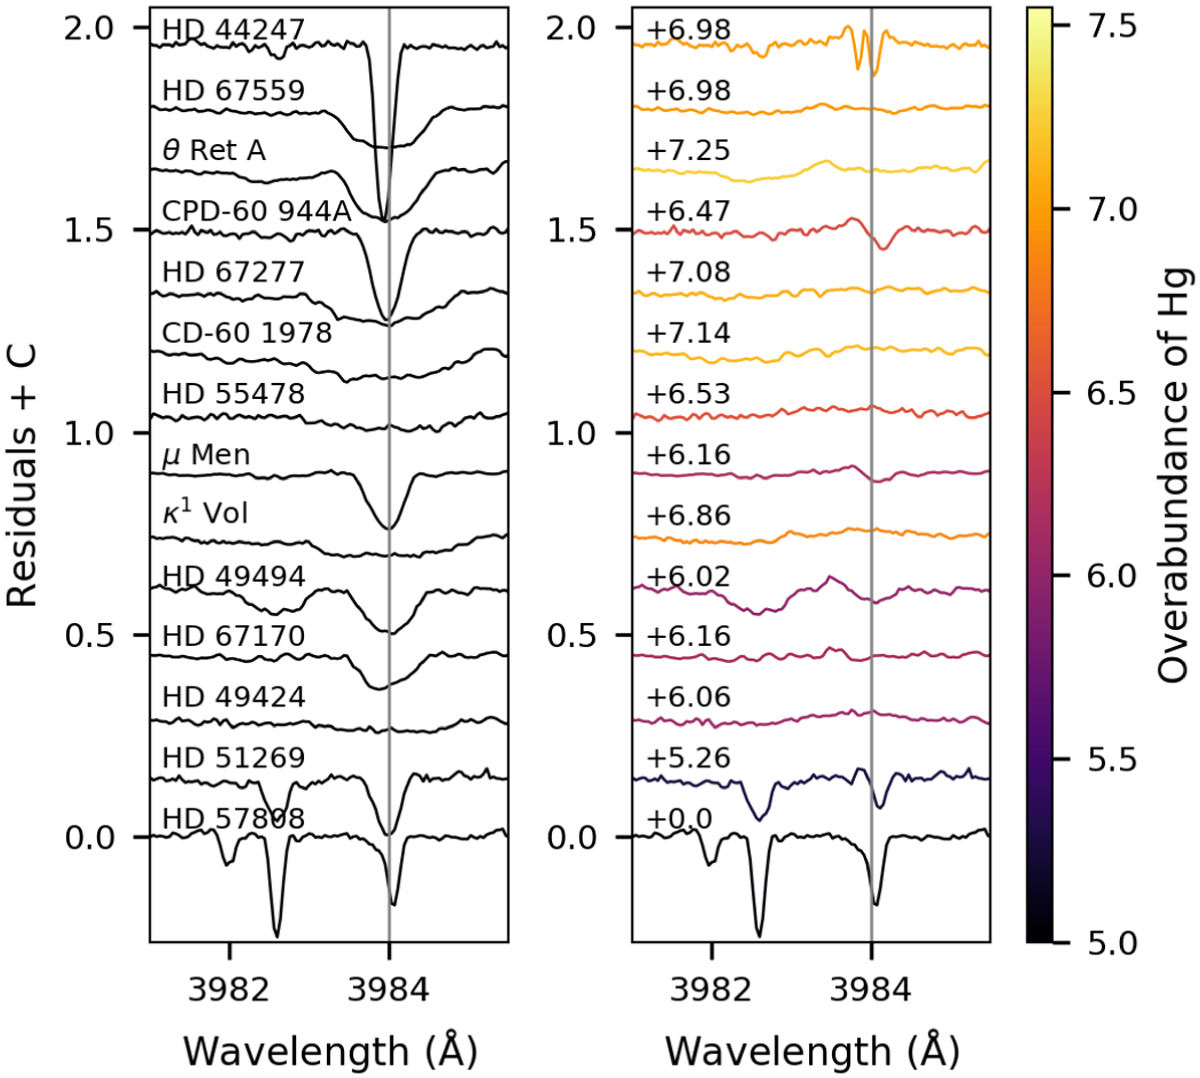
Overabundance of Hg in HgMn stars. The left panel shows residuals around the Hg II3984 line between the observed spectrum and best-fitting GSSP spectrum with the Hg abundance according to the metallicity of the star. The right panel shows the residuals when the Hg abundance is optimised for the star. The residuals in the right panel are colour-coded according to the Hg overabundance with respect to the abundance in the left panel. The value is also given for each star. The residuals of the different stars are offset with a constant value to plot all stars in the same figure.
Current usage metrics show cumulative count of Article Views (full-text article views including HTML views, PDF and ePub downloads, according to the available data) and Abstracts Views on Vision4Press platform.
Data correspond to usage on the plateform after 2015. The current usage metrics is available 48-96 hours after online publication and is updated daily on week days.
Initial download of the metrics may take a while.