Fig. 1
Download original image
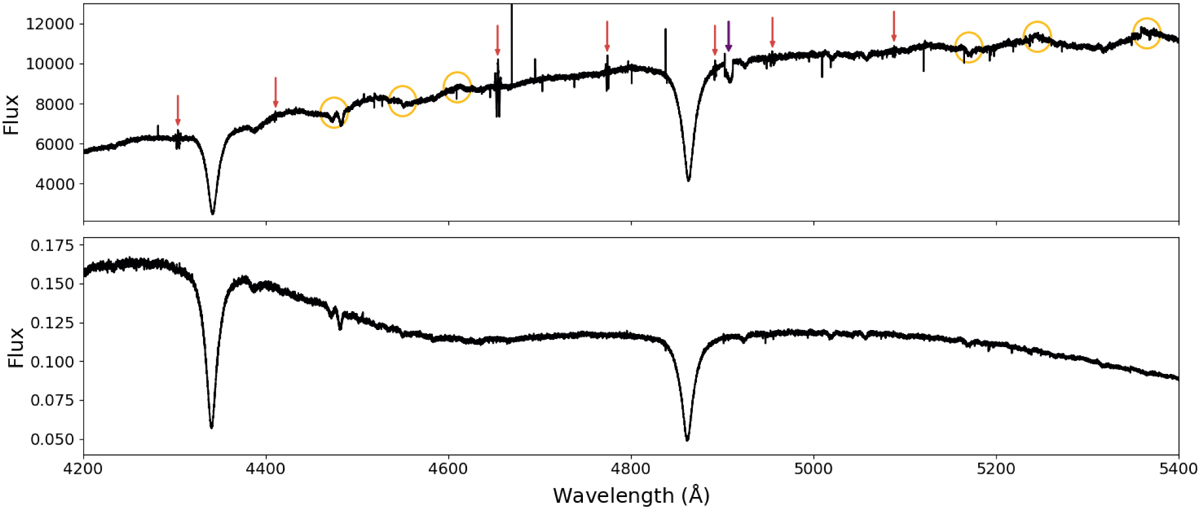
Comparison of the original CERES pipeline with the adapted pipeline. Top: spectrum of the B9V star HD 33244 reduced with the original CERES pipeline. Red and purple arrows indicate the positions of wiggles and a gap, and yellow circles show the positions of some bumps (see the text for an explanation of these features). Bottom: spectrum of HD 33244 reduced with the new version of the CERES pipeline that includes the four changes described in Sect. 3.
Current usage metrics show cumulative count of Article Views (full-text article views including HTML views, PDF and ePub downloads, according to the available data) and Abstracts Views on Vision4Press platform.
Data correspond to usage on the plateform after 2015. The current usage metrics is available 48-96 hours after online publication and is updated daily on week days.
Initial download of the metrics may take a while.